Software License Cost (Quick Chart)



Overview
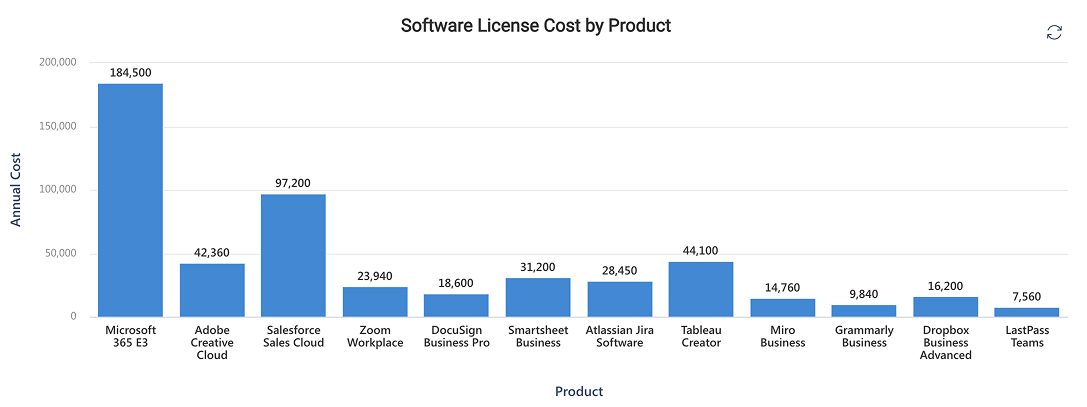
- Column chart, the first of the two chart types the Quick Chart web part offers, rendering annual cost by product
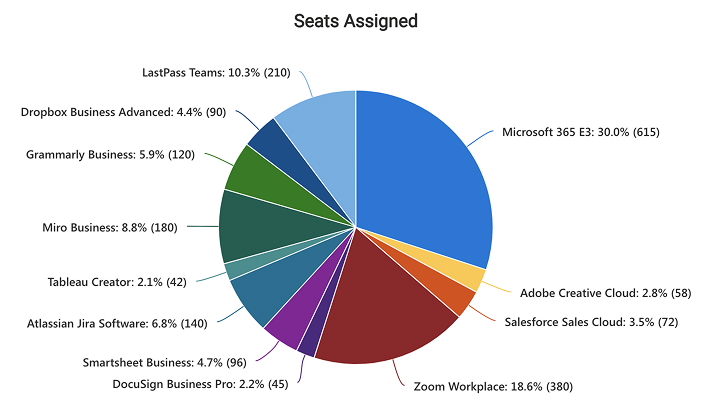
- Pie chart, the web part’s second chart type, added as a separate Quick Chart web part on the same page so one dataset answers two questions at once
- Automatic value labels above every column, so each figure is read directly rather than estimated against the gridlines
- A value axis the web part scales and labels on its own, starting at zero and rising in even steps
- Chart title plus custom X and Y axis titles, all typed straight into the web part property pane
- Pie slices labeled automatically with the category, its percentage, and the underlying value – built-in behavior rather than a setting to switch on
- Both charts read their source live and cap at fifty data points, the web part’s display ceiling; a typical product list sits comfortably inside it
Benefits
- Puts the license bill in front of the people who approve it, on the intranet page they already open
- Makes the concentration obvious – when one product carries a large share of the annual spend
- Pairs cost against seats, which is where the renewal conversation actually starts: a widely used tool can cost far less than a niche one with only a handful of seats
- Turns a list IT already maintains into reporting, with no new system to buy or roll out
- Serves both the IT director and the finance partner, because both charts come off the same list
- Reads the list live, so the chart moves when someone edits a cost
- Takes about five minutes to set up, with no code and nothing to license beyond Microsoft 365
Details
- Chart Types: Column chart, Pie chart
Common Questions About the Software License Cost Chart
What is this software license chart built with?
The Quick Chart web part, out of the box in SharePoint, pointed at a standard SharePoint list. There is no third-party reporting tool, no Copilot license, and nothing to license beyond Microsoft 365. Both charts sit directly on a SharePoint page next to the list they read from – the kind of clean, maintainable reporting Greg Zelfond builds for IT teams.
What is included in this software license example?
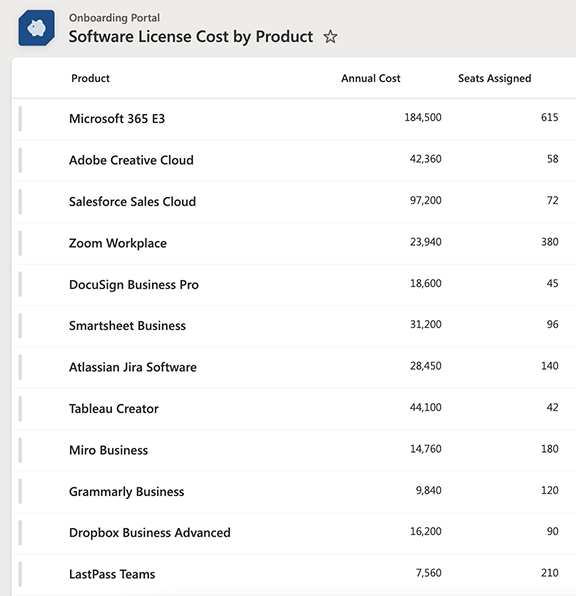
A SharePoint list with one row per licensed product, a column chart of annual cost by product, and a pie chart of seats assigned. The column chart ranks the spend from the most expensive product down to the cheapest. The pie splits assigned seats across the same products.
Where does the chart data come from?
A single SharePoint list with three columns – product, annual cost, and seats assigned – and one row per product. Quick Chart plots rows exactly as they sit, so the list is pre-aggregated at one row per product. The second number column, seats assigned, is what lets the same list drive a pie chart without building a second one.
What are the limits of the Quick Chart web part?
Four worth knowing. It draws column and pie charts only. It shows at most fifty items. The list needs one text column for the X axis and one number or currency column for the Y axis, or it will not appear as a data source. And it does no grouping or summing – one row becomes one data point, so the list must be pre-aggregated. It does read the list live, so edits appear without republishing.
Should we use Copilot, the Quick Chart web part, or Power BI?
It depends on how much you need. The Quick Chart web part is the lightest option – one chart, pointed at a list, no setup. A Copilot-generated dashboard suits a full page with filters and several linked charts that move together. Power BI earns its place when data volumes are large, sources need joining, or row-level security and scheduled refresh matter.
Can Greg build this for our organization?
Yes – this is exactly the kind of work Greg Zelfond does. As an independent SharePoint consultant and Microsoft MVP, he sets up the underlying list, shapes the columns so the chart is worth drawing, and builds the reporting around the questions your leadership actually asks rather than the ones the data happens to answer. Reach out through the contact page.