Quick Chart Web Part

Benefits
- No tools required: create a column or pie chart directly on the page, with no Excel files or Power BI reports involved.
- Two data sources: type in up to 12 data points by hand or pull values from a list or library on the same site.
- Always current: charts connected to a list refresh automatically when the underlying data changes.
- Theme-matched: the chart inherits your site theme colors, so every chart matches your branding without a color picker.
- Clear labeling: add a chart title and, on column charts, labels for both axes.
- Dashboard ready: turn one numeric list column into a visual that makes metrics readable at a glance.
Settings
Web part level:
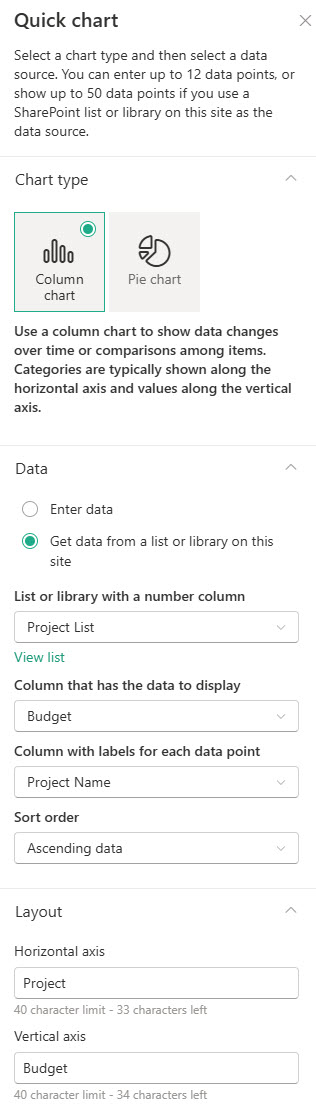
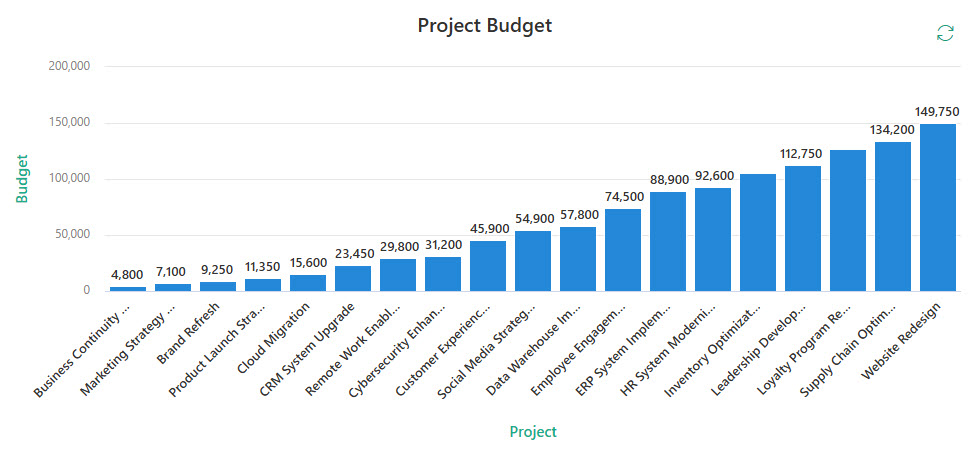
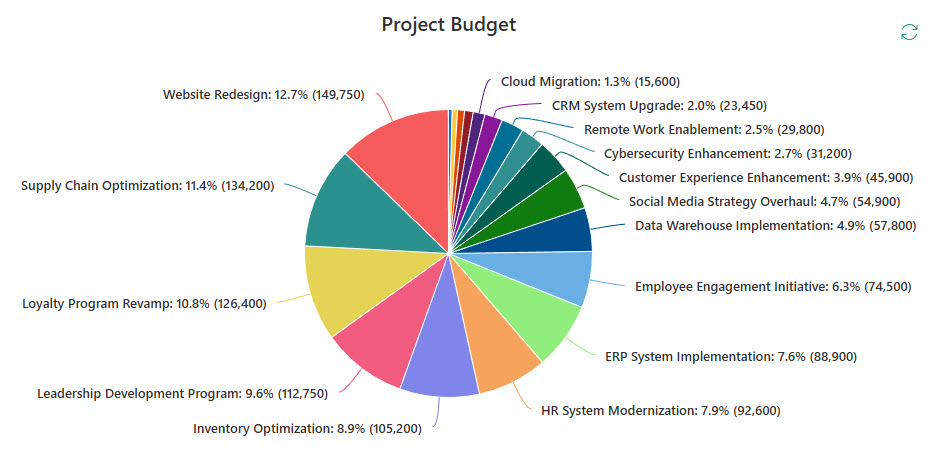
- Chart type: column or pie. Column charts compare values side by side (such as budgets by project) and support optional axis labels; pie charts show parts of a whole, so keep them to a handful of slices for readable labels.
- Data: enter data manually, or get data from a SharePoint list or library on this site.
- Column that has data to display: the values column; it must contain numbers for the chart to work.
- Sort options: control the order of data points, which also affects which items appear when a list has more than 50.
- Layout (column charts only): optional text labels for the horizontal (x) and vertical (y) axes. The chart is responsive and interactive – pointing at a column or slice reveals its value.
- Chart title: the heading displayed above the chart, edited directly on the chart rather than in the web part settings.
Per data point (manual entry only):
- Label and value: the text shown under the column or next to the pie slice, and the numeric value for that data point.
Limits and Nuances
- Manual entry caps at 12 data points: for anything bigger, switch to a list or library source.
- A list or library source displays a maximum of 50 items: SharePoint warns ‘Only 50 items in this list will be displayed.’ Sorting options affect which 50 make the cut.
- The data source must live on the same site as the page: there is no option to chart a list from another site.
- Source list requirements: the list needs at least one text column and at least one number or currency column, or it will not appear and you get the ‘No list available on this site’ message.
- There is no grouping or aggregation: the chart plots one data point per list item. To chart counts or sums by category, calculate those numbers in the list first, or use Power BI.
- Document libraries work as a source too, not just lists: for example, chart invoice amounts stored as a column in an Invoices library.
- Only two chart types exist: column and pie. There are no line, donut, area, or stacked charts, and axis labels apply to column charts only – a pie chart gets just the title and slice labels.
- Automatic refresh works for list sources only: charts based on a list update when the underlying data changes, while manually entered data stays static until you edit the web part.
Quick Chart vs. the Alternatives
- Quick Chart vs. Power BI web part: use Quick Chart for one simple visual from a small list; use Power BI when you need interactive reports, multiple data sources, filters, or more than 50 data points.
- Quick Chart vs. an embedded Excel chart: if the chart already lives in a workbook, or you need a chart type Quick Chart lacks, embed the Excel file instead and keep the workbook as the single source of truth.
- Quick Chart vs. the List web part: the List web part shows the raw rows with formatting and views; Quick Chart turns one numeric column into a visual. Many pages benefit from showing both side by side.
Common Questions About the Quick Chart Web Part
How many data points can the Quick Chart web part display?
It depends on the data source. With manual entry, you can add up to 12 data points – that is the hard cap. With a SharePoint list or library as the source, the chart displays a maximum of 50 items, and SharePoint shows a warning when the list is larger. The sort options you choose determine which 50 items appear, so sort deliberately.
What chart types does the Quick Chart web part support?
Two: a column chart and a pie chart. Column charts work best for comparing values side by side and support optional x and y axis labels. Pie charts work best for showing parts of a whole. There are no line, donut, area, or stacked options – if you need those, embed an Excel chart or use the Power BI web part instead.
Can the Quick Chart web part pull data from another site or from Excel?
No. The list or library source must live on the same site as the page – there is no cross-site option, and Excel files cannot be used as a source. If your numbers live elsewhere, either enter up to 12 data points manually, copy the data into a list on the site, or embed the Excel chart with a different web part.
Why does my list not show up as a data source for the Quick Chart?
The web part only offers lists and libraries that meet two conditions: at least one text column for the labels, and at least one number or currency column for the values. If either is missing, you see the ‘No list available on this site’ message. Add a number or currency column to the list and it will appear in the source dropdown.
Can I change the colors of a Quick Chart?
There is no color picker in the web part – the chart inherits the colors of your site theme. That is actually a feature in disguise: change the theme and every chart on the site updates to match. The dashboards on LookBook 365 use this exact web part paired with a custom theme, which is the only way Greg Zelfond builds – out-of-the-box web parts, branded through theming.
Does a Quick Chart update automatically when the list changes?
Yes, when the chart is connected to a list or library. The web part reads the current data each time the page loads, so new items, edits, and deletions show up without anyone touching the page. Manually entered data is the opposite – it is stored in the web part itself and stays frozen until someone edits the page and updates the values. Quick Chart Web Part Bar Chart Quick Chart Web Part Pie Chart Quick Chart Web Part Configuration Settings