
RACI Chart

The RACI Chart is an out-of-the-box roles and responsibilities tracker built in Microsoft Lists, designed for project managers and stakeholders to clarify who is Responsible, Accountable, Consulted, and Informed for every project task. With no custom code or third-party tools, it brings together a color-coded list view, a gallery view, a grouped-by-assignment view, and a simple entry screen - giving teams and departments instant clarity on who owns what.
Built with
Keywords
Project Management
Category
Projects

Want one like this?

Talk to Greg
  • Multiple Views: the same chart can be displayed as a standard list, a gallery view, or grouped by assignment for per-person reporting
  • Improved Accountability: Ensure clarity on who’s doing what and who’s in charge
  • Project Transparency: Promote alignment across departments with a single source of truth
  • Dynamic Collaboration: Real-time updates ensure the chart stays accurate and relevant throughout the project
  • Visual Clarity: Color-coded formatting makes it easy to identify roles at a glance
  • Flexible Views: Filter by role or task for personalized reporting
  • Scalable & Reusable: Clone or adapt the list structure for future projects or other governance needs

Common Questions About This RACI Chart

What is this RACI Chart built with?

The RACI Chart is built entirely with Microsoft Lists, part of Microsoft 365. It uses standard list capabilities – choice columns for the four RACI roles, color-coded formatting, filtering, sorting, and grouping – with no custom code and no third-party tools. It is the kind of clean, maintainable project tracker Greg Zelfond builds for project managers who need role clarity across teams and departments.

What’s included in the RACI Chart?

The design assigns Responsible, Accountable, Consulted, and Informed roles across project tasks, with color-coded indicators that make each role easy to spot at a glance. It includes a standard list view, filtering for personalized reporting, a view grouped by assignment so each person can see their responsibilities, a gallery view, and a simple entry screen for adding or updating tasks.

Does this design use any custom code or third-party tools?

No. Everything in this RACI Chart uses standard Microsoft Lists functionality available in Microsoft 365. That matters because out-of-the-box solutions are stable, secure, and easy to maintain – nothing breaks when Microsoft rolls out updates, and there are no third-party licenses to manage. Out-of-the-box is the only way Greg builds.

Can this RACI Chart be customized for our organization?

Absolutely. The tasks, role columns, colors, and views can all be tailored to your project structure and governance model. Greg adapts the chart to the way your organization actually assigns ownership – whether that means department-level responsibilities, project phases, or a reusable template you clone for every new initiative – so the RACI reflects your real teams, not a generic example.

How does the color-coding work in Microsoft Lists?

The colors come from standard column formatting in Microsoft Lists, which applies background colors to the Responsible, Accountable, Consulted, and Informed values automatically as entries are added or changed. Because the formatting is part of the list itself, every view stays color-coded and nobody has to repaint cells the way they would in a spreadsheet. It makes role scanning fast for everyone.

Can Greg build this RACI Chart for our organization?

Yes – this is exactly the kind of work Greg Zelfond does. As an independent SharePoint and Microsoft 365 consultant and Microsoft MVP, he designs and builds out-of-the-box project trackers like this one, tailored to your projects, roles, and reporting needs. If you want a RACI chart your stakeholders will actually reference, reach out through the contact page to get started.

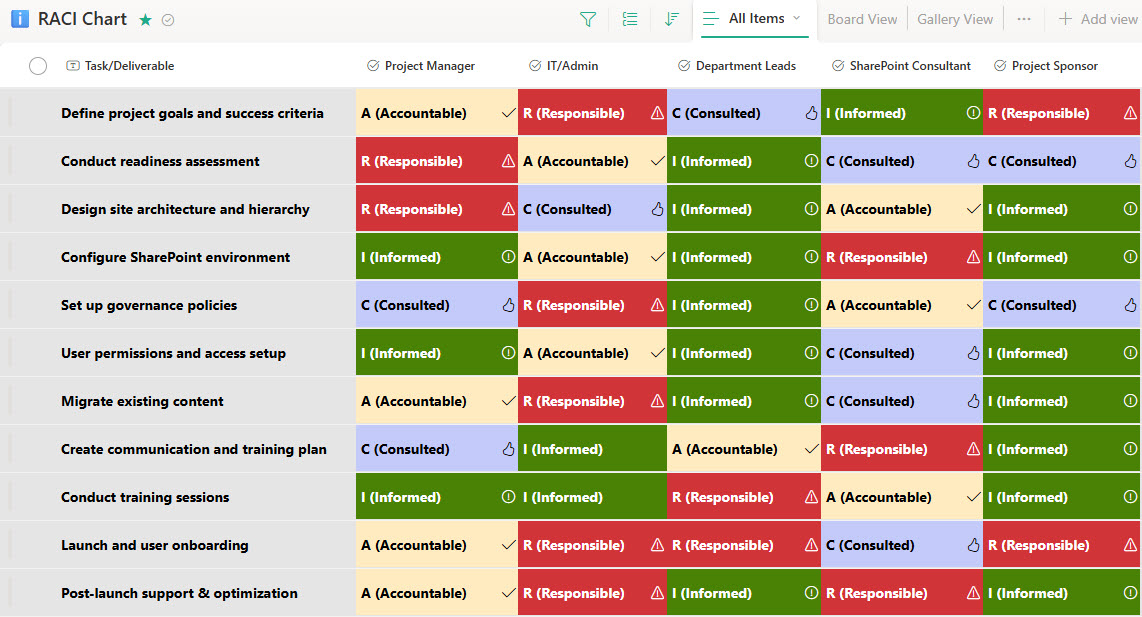
RACI Chart (List View)
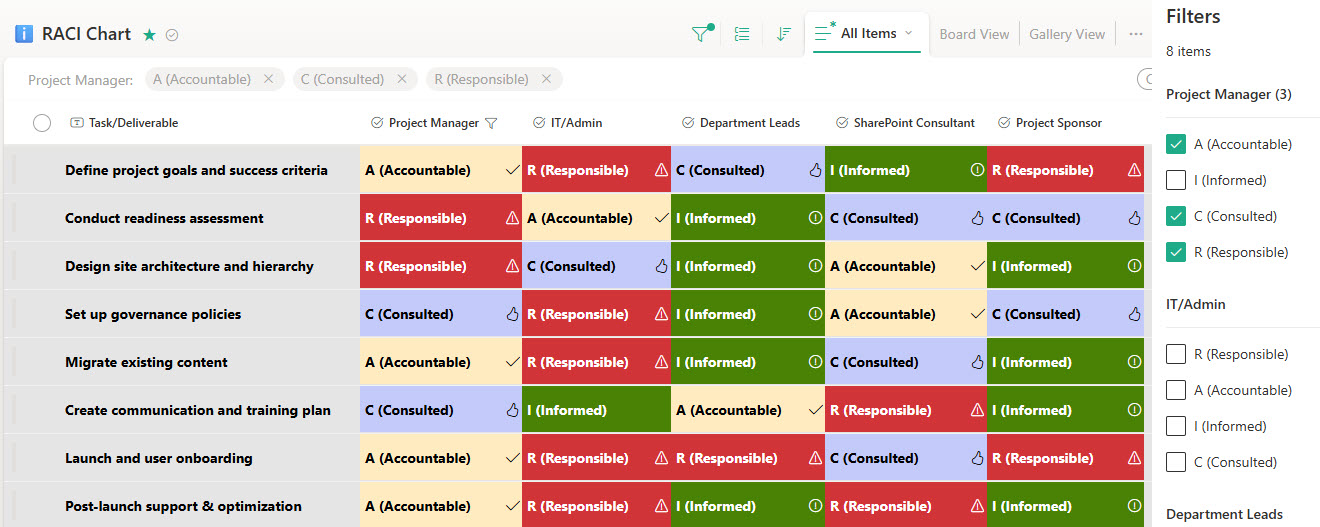
RACI Chart Filtering
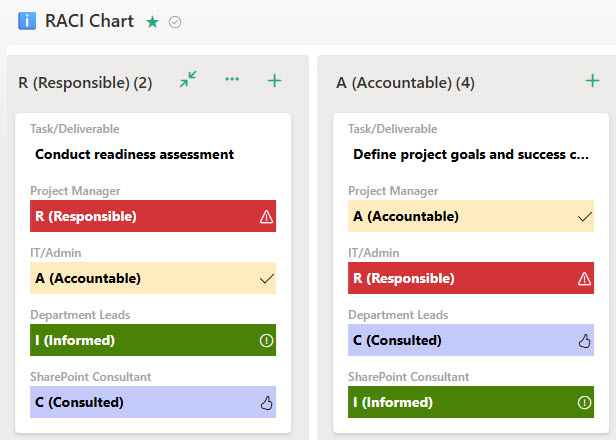
RACI Chart (Grouped By Assignment)
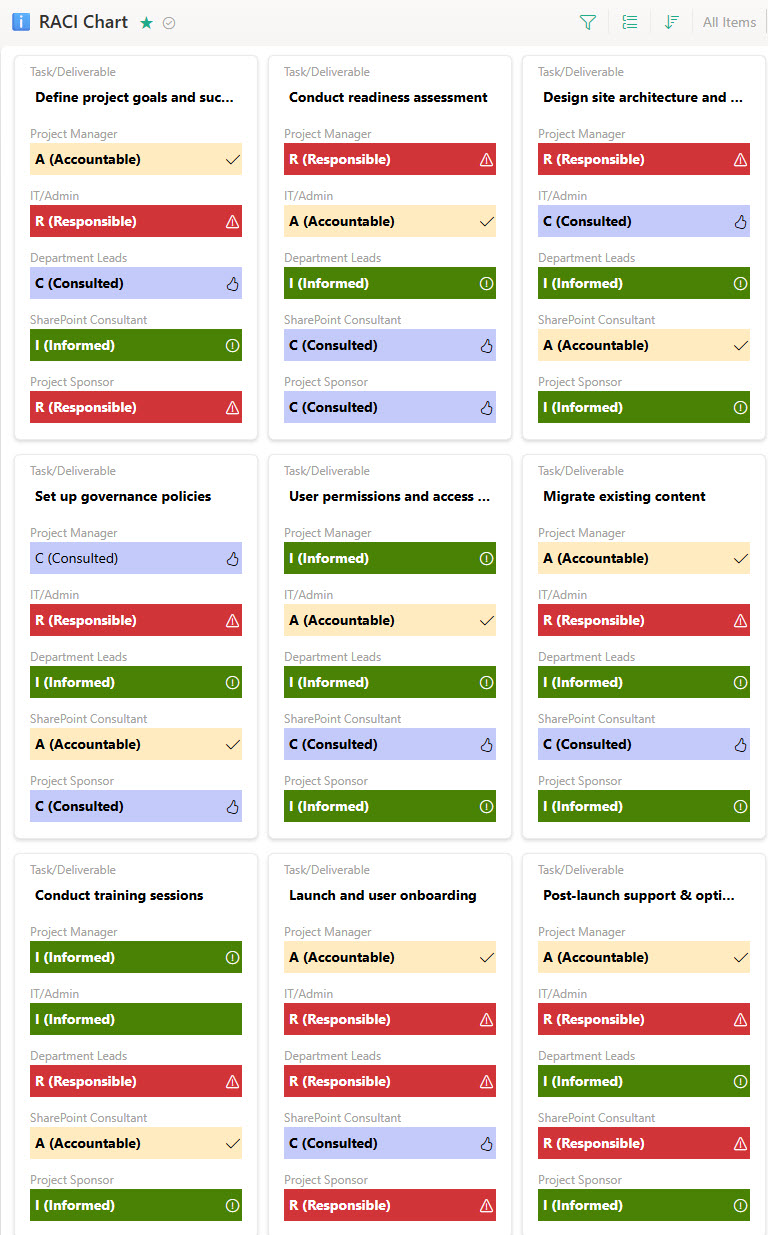
RACI Chart (Gallery View)
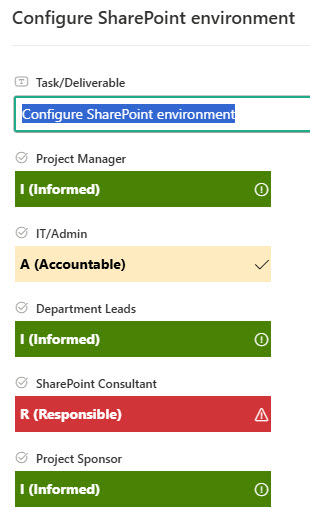
RACI Chart Entry Screen