Column Formatting
Common Use Cases
- Status pills: color-coded labels such as Open, In Progress, and Done
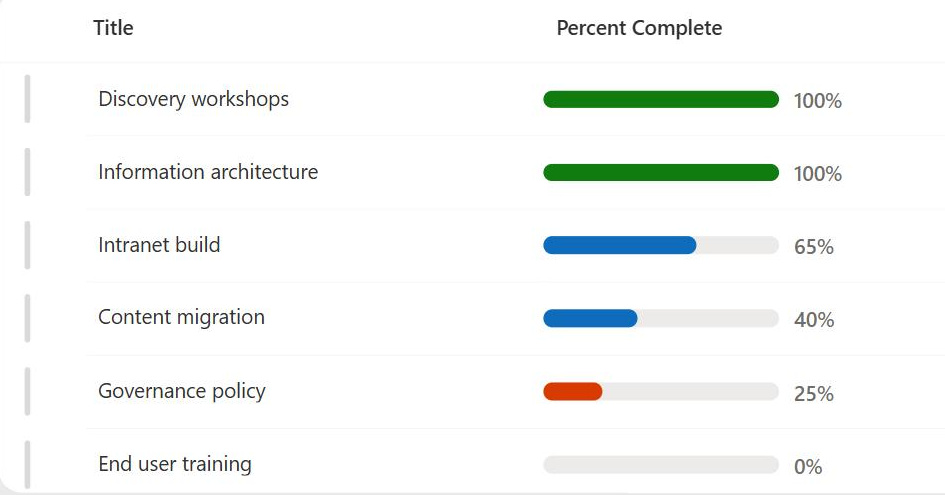
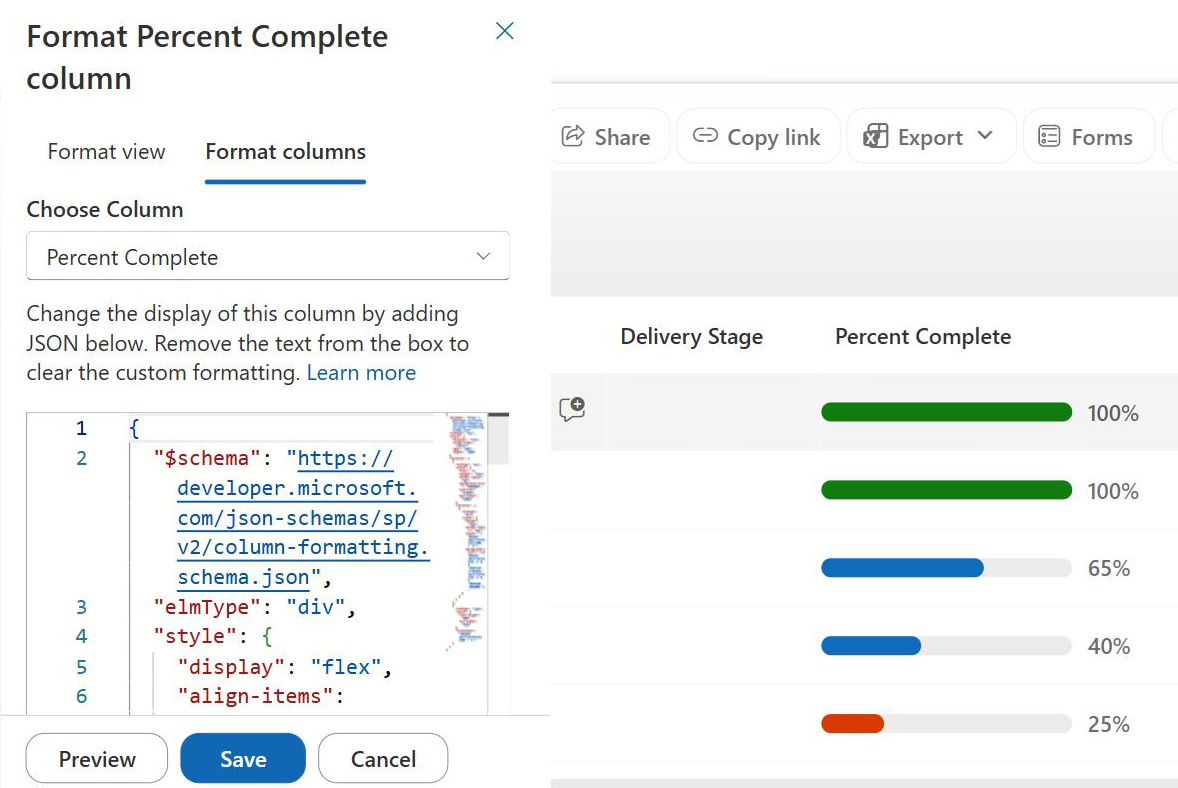
- Data bars: a bar whose length reflects a number, like percent complete
- Icons: a checkmark, flag, or warning sign tied to a value
- Clickable elements: turning a value into a link or an action button
- Conditional color: red, amber, or green based on a threshold
- Trend cues: arrows or symbols that signal direction at a glance
Benefits
- At-a-glance reading: users scan color and shape instead of parsing text
- No-code option: the design panel builds common styles without JSON
- Reusable: the format saves with the view and applies to every item
- Non-destructive: it only changes appearance, never the stored data
- Conditional logic: styles respond to the value in each row
- Consistent: everyone viewing the list sees the same visual rules
Details
- Feature Category: Columns & Views
Limits and Nuances
- Presentational only: it never filters, sorts, or changes the data
- Column type matters: some types support fewer formatting options
- JSON can get complex: elaborate styles are harder to maintain
- Mobile rendering: some styles render differently on phones
- View-scoped: applying it everywhere means formatting each view
Column Formatting Examples
The worked examples below cover the column treatments teams ask for most: status badges, progress and metric visuals, date and deadline indicators, cards, people, and file display. Each one is out-of-the-box column formatting JSON you can copy and paste as it is.
Status Label
Turns any status or choice value into a clean colored pill, so a whole column reads at a glance instead of as plain text. A leading status dot and a tinted background share one semantic color – green for good, amber for caution, red for problems, and blue for in-progress – and any value that is not mapped, or is blank, falls back to a neutral pill so the column never looks broken.
Required Columns
| Display name | Column type | Internal name |
|---|---|---|
| Title | Single line of text | [Title] |
| Status | Choice | [Status] |
| Owner | Person or Group | [Owner] |
| Updated | Date and time | [Updated] |
Prerequisites
- Build a list with these columns before you paste the JSON.
- Populate the list with data.
- Because the JSON is applied at the column level, the Status column can use any name you want.
- It matches values by exact text, so edit the value lists inside the JSON to fit your own choices; anything it does not recognize shows a neutral Not set pill.
JSON Instructions
- On the Status column, open the column header menu, choose Column settings, then Format this column.
- Switch to Advanced mode.
- Paste the JSON below and click Save.
{
  "$schema": "https://developer.microsoft.com/json-schemas/sp/v2/column-formatting.schema.json",
  "elmType": "div",
  "style": {
    "display": "flex",
    "align-items": "center",
    "justify-content": "flex-start",
    "height": "100%",
    "width": "100%"
  },
  "children": [
    {
      "elmType": "div",
      "style": {
        "display": "inline-flex",
        "align-items": "center",
        "box-sizing": "border-box",
        "max-width": "100%",
        "height": "26px",
        "padding": "2px 10px 2px 8px",
        "margin": "3px 0",
        "border-radius": "13px",
        "background-color": "=if((@currentField == 'On Track' || @currentField == 'Approved' || @currentField == 'Compliant' || @currentField == 'Resolved' || @currentField == 'Healthy'), '#d5f2dc', if((@currentField == 'At Risk' || @currentField == 'In Review' || @currentField == 'Pending' || @currentField == 'Monitoring'), '#ffe2b8', if((@currentField == 'Critical' || @currentField == 'Blocked' || @currentField == 'Non-Compliant' || @currentField == 'Overdue'), '#ffd9dd', if((@currentField == 'In Progress' || @currentField == 'New' || @currentField == 'Open' || @currentField == 'Scheduled'), '#e1efff', '#eeeeee'))))"
      },
      "children": [
        {
          "elmType": "div",
          "style": {
            "width": "8px",
            "height": "8px",
            "border-radius": "50%",
            "margin-right": "7px",
            "flex-shrink": "0",
            "background-color": "=if((@currentField == 'On Track' || @currentField == 'Approved' || @currentField == 'Compliant' || @currentField == 'Resolved' || @currentField == 'Healthy'), '#159447', if((@currentField == 'At Risk' || @currentField == 'In Review' || @currentField == 'Pending' || @currentField == 'Monitoring'), '#d98200', if((@currentField == 'Critical' || @currentField == 'Blocked' || @currentField == 'Non-Compliant' || @currentField == 'Overdue'), '#e01e37', if((@currentField == 'In Progress' || @currentField == 'New' || @currentField == 'Open' || @currentField == 'Scheduled'), '#0878cf', '#9b9b9b'))))"
          }
        },
        {
          "elmType": "span",
          "style": {
            "font-size": "13px",
            "font-weight": "700",
            "line-height": "20px",
            "white-space": "nowrap",
            "overflow": "hidden",
            "text-overflow": "ellipsis",
            "color": "=if((@currentField == 'On Track' || @currentField == 'Approved' || @currentField == 'Compliant' || @currentField == 'Resolved' || @currentField == 'Healthy'), '#006b2b', if((@currentField == 'At Risk' || @currentField == 'In Review' || @currentField == 'Pending' || @currentField == 'Monitoring'), '#9a5600', if((@currentField == 'Critical' || @currentField == 'Blocked' || @currentField == 'Non-Compliant' || @currentField == 'Overdue'), '#b21f32', if((@currentField == 'In Progress' || @currentField == 'New' || @currentField == 'Open' || @currentField == 'Scheduled'), '#075da8', '#555555'))))"
          },
          "txtContent": "=if(@currentField == '', 'Not set', @currentField)"
        }
      ]
    }
  ]
}Country Flag
Shows a flag glyph next to a country or region value, so a global list reads at a glance and scans by flag instead of by text. The JSON matches the country name to its flag and keeps the name beside it, with a neutral flag for anything unmatched.
Required Columns
| Display name | Column type | Internal name |
|---|---|---|
| Account | Single line of text | [Title] |
| Region | Choice | [Region] |
Prerequisites
- Build a list with a choice or text column for the country before you paste the JSON.
- Then populate the list with country names.
- The JSON keys off specific country names; use these exact names in your column or add your countries to the map in the JSON (a neutral flag covers the rest).
- Apply the formatting to the country column.
- Flags are provided for only ten mapped country names, and the names are case-sensitive – adding another country means adding its SVG flag to the JSON, not just its name.
JSON Instructions
- On the Region column, open the column header menu, choose Column settings, then Format this column.
- Switch to Advanced mode.
- Paste the JSON below and click Save.
{
"$schema": "https://developer.microsoft.com/json-schemas/sp/v2/column-formatting.schema.json",
"elmType": "div",
"style": {
"display": "flex",
"align-items": "center",
"gap": "10px",
"min-height": "26px",
"white-space": "nowrap"
},
"children": [
{
"elmType": "div",
"style": {
"width": "30px",
"height": "20px",
"flex-shrink": "0",
"overflow": "hidden",
"border": "1px solid #A19F9D",
"border-radius": "2px",
"background-color": "#F3F2F1"
},
"children": [
{
"elmType": "svg",
"attributes": {
"viewBox": "0 0 30 20",
"preserveAspectRatio": "none"
},
"style": {
"display": "=if(@currentField == 'United States', 'block', 'none')",
"width": "100%",
"height": "100%"
},
"children": [
{
"elmType": "path",
"attributes": {
"d": "M0 0H30V20H0Z"
},
"style": {
"fill": "#FFFFFF"
}
},
{
"elmType": "path",
"attributes": {
"d": "M0 0H30V2H0ZM0 4H30V6H0ZM0 8H30V10H0ZM0 12H30V14H0ZM0 16H30V18H0Z"
},
"style": {
"fill": "#B22234"
}
},
{
"elmType": "path",
"attributes": {
"d": "M0 0H13V10H0Z"
},
"style": {
"fill": "#3C3B6E"
}
}
]
},
{
"elmType": "svg",
"attributes": {
"viewBox": "0 0 30 20",
"preserveAspectRatio": "none"
},
"style": {
"display": "=if(@currentField == 'Japan', 'block', 'none')",
"width": "100%",
"height": "100%"
},
"children": [
{
"elmType": "path",
"attributes": {
"d": "M0 0H30V20H0Z"
},
"style": {
"fill": "#FFFFFF"
}
},
{
"elmType": "path",
"attributes": {
"d": "M15 5A5 5 0 1 0 15 15A5 5 0 1 0 15 5Z"
},
"style": {
"fill": "#BC002D"
}
}
]
},
{
"elmType": "svg",
"attributes": {
"viewBox": "0 0 30 20",
"preserveAspectRatio": "none"
},
"style": {
"display": "=if(@currentField == 'Germany', 'block', 'none')",
"width": "100%",
"height": "100%"
},
"children": [
{
"elmType": "path",
"attributes": {
"d": "M0 0H30V6.67H0Z"
},
"style": {
"fill": "#000000"
}
},
{
"elmType": "path",
"attributes": {
"d": "M0 6.67H30V13.34H0Z"
},
"style": {
"fill": "#DD0000"
}
},
{
"elmType": "path",
"attributes": {
"d": "M0 13.34H30V20H0Z"
},
"style": {
"fill": "#FFCE00"
}
}
]
},
{
"elmType": "svg",
"attributes": {
"viewBox": "0 0 30 20",
"preserveAspectRatio": "none"
},
"style": {
"display": "=if(@currentField == 'United Kingdom', 'block', 'none')",
"width": "100%",
"height": "100%"
},
"children": [
{
"elmType": "path",
"attributes": {
"d": "M0 0H30V20H0Z"
},
"style": {
"fill": "#012169"
}
},
{
"elmType": "path",
"attributes": {
"d": "M0 0H4L30 16V20H26L0 4ZM30 0H26L0 16V20H4L30 4Z"
},
"style": {
"fill": "#FFFFFF"
}
},
{
"elmType": "path",
"attributes": {
"d": "M0 0H2L30 18V20H28L0 2ZM30 0H28L0 18V20H2L30 2Z"
},
"style": {
"fill": "#C8102E"
}
},
{
"elmType": "path",
"attributes": {
"d": "M11 0H19V20H11Z"
},
"style": {
"fill": "#FFFFFF"
}
},
{
"elmType": "path",
"attributes": {
"d": "M0 6H30V14H0Z"
},
"style": {
"fill": "#FFFFFF"
}
},
{
"elmType": "path",
"attributes": {
"d": "M13 0H17V20H13ZM0 8H30V12H0Z"
},
"style": {
"fill": "#C8102E"
}
}
]
},
{
"elmType": "svg",
"attributes": {
"viewBox": "0 0 30 20",
"preserveAspectRatio": "none"
},
"style": {
"display": "=if(@currentField == 'France', 'block', 'none')",
"width": "100%",
"height": "100%"
},
"children": [
{
"elmType": "path",
"attributes": {
"d": "M0 0H10V20H0Z"
},
"style": {
"fill": "#0055A4"
}
},
{
"elmType": "path",
"attributes": {
"d": "M10 0H20V20H10Z"
},
"style": {
"fill": "#FFFFFF"
}
},
{
"elmType": "path",
"attributes": {
"d": "M20 0H30V20H20Z"
},
"style": {
"fill": "#EF4135"
}
}
]
},
{
"elmType": "svg",
"attributes": {
"viewBox": "0 0 30 20",
"preserveAspectRatio": "none"
},
"style": {
"display": "=if(@currentField == 'Canada', 'block', 'none')",
"width": "100%",
"height": "100%"
},
"children": [
{
"elmType": "path",
"attributes": {
"d": "M0 0H30V20H0Z"
},
"style": {
"fill": "#D80621"
}
},
{
"elmType": "path",
"attributes": {
"d": "M7.5 0H22.5V20H7.5Z"
},
"style": {
"fill": "#FFFFFF"
}
},
{
"elmType": "path",
"attributes": {
"d": "M15 2.5L16.2 6L19 5L17.8 8L20.5 9.2L17.5 10.4L18.2 13L15.8 11.7L15.6 17H14.4L14.2 11.7L11.8 13L12.5 10.4L9.5 9.2L12.2 8L11 5L13.8 6Z"
},
"style": {
"fill": "#D80621"
}
}
]
},
{
"elmType": "svg",
"attributes": {
"viewBox": "0 0 30 20",
"preserveAspectRatio": "none"
},
"style": {
"display": "=if(@currentField == 'Australia', 'block', 'none')",
"width": "100%",
"height": "100%"
},
"children": [
{
"elmType": "path",
"attributes": {
"d": "M0 0H30V20H0Z"
},
"style": {
"fill": "#012169"
}
},
{
"elmType": "path",
"attributes": {
"d": "M0 0H2L15 8V10H13L0 2ZM15 0H13L0 8V10H2L15 2Z"
},
"style": {
"fill": "#FFFFFF"
}
},
{
"elmType": "path",
"attributes": {
"d": "M5.5 0H9.5V10H5.5ZM0 3H15V7H0Z"
},
"style": {
"fill": "#FFFFFF"
}
},
{
"elmType": "path",
"attributes": {
"d": "M6.5 0H8.5V10H6.5ZM0 4H15V6H0Z"
},
"style": {
"fill": "#C8102E"
}
},
{
"elmType": "path",
"attributes": {
"d": "M22 3L23 5.5L25.5 5.5L23.5 7L24.3 9.5L22 8L19.7 9.5L20.5 7L18.5 5.5L21 5.5Z"
},
"style": {
"fill": "#FFFFFF"
}
},
{
"elmType": "path",
"attributes": {
"d": "M24 13L24.7 14.5L26.2 14.5L25 15.4L25.5 17L24 16L22.5 17L23 15.4L21.8 14.5L23.3 14.5Z"
},
"style": {
"fill": "#FFFFFF"
}
}
]
},
{
"elmType": "svg",
"attributes": {
"viewBox": "0 0 30 20",
"preserveAspectRatio": "none"
},
"style": {
"display": "=if(@currentField == 'India', 'block', 'none')",
"width": "100%",
"height": "100%"
},
"children": [
{
"elmType": "path",
"attributes": {
"d": "M0 0H30V6.67H0Z"
},
"style": {
"fill": "#FF9933"
}
},
{
"elmType": "path",
"attributes": {
"d": "M0 6.67H30V13.34H0Z"
},
"style": {
"fill": "#FFFFFF"
}
},
{
"elmType": "path",
"attributes": {
"d": "M0 13.34H30V20H0Z"
},
"style": {
"fill": "#138808"
}
},
{
"elmType": "path",
"attributes": {
"d": "M15 8A2 2 0 1 0 15 12A2 2 0 1 0 15 8Z"
},
"style": {
"fill": "#000080"
}
}
]
},
{
"elmType": "svg",
"attributes": {
"viewBox": "0 0 30 20",
"preserveAspectRatio": "none"
},
"style": {
"display": "=if(@currentField == 'Brazil', 'block', 'none')",
"width": "100%",
"height": "100%"
},
"children": [
{
"elmType": "path",
"attributes": {
"d": "M0 0H30V20H0Z"
},
"style": {
"fill": "#009C3B"
}
},
{
"elmType": "path",
"attributes": {
"d": "M15 2.5L27 10L15 17.5L3 10Z"
},
"style": {
"fill": "#FFDF00"
}
},
{
"elmType": "path",
"attributes": {
"d": "M15 6A4 4 0 1 0 15 14A4 4 0 1 0 15 6Z"
},
"style": {
"fill": "#002776"
}
}
]
},
{
"elmType": "svg",
"attributes": {
"viewBox": "0 0 30 20",
"preserveAspectRatio": "none"
},
"style": {
"display": "=if(@currentField == 'Mexico', 'block', 'none')",
"width": "100%",
"height": "100%"
},
"children": [
{
"elmType": "path",
"attributes": {
"d": "M0 0H10V20H0Z"
},
"style": {
"fill": "#006847"
}
},
{
"elmType": "path",
"attributes": {
"d": "M10 0H20V20H10Z"
},
"style": {
"fill": "#FFFFFF"
}
},
{
"elmType": "path",
"attributes": {
"d": "M20 0H30V20H20Z"
},
"style": {
"fill": "#CE1126"
}
},
{
"elmType": "path",
"attributes": {
"d": "M15 7A3 3 0 1 0 15 13A3 3 0 1 0 15 7Z"
},
"style": {
"fill": "#8A6D3B"
}
}
]
}
]
},
{
"elmType": "span",
"txtContent": "=if(@currentField == '', '—', @currentField)",
"style": {
"font-size": "14px",
"font-weight": "600",
"color": "#201F1E",
"line-height": "20px"
}
}
]
}Toggle Switch
Turns a yes/no column into a real-looking on/off switch, so a boolean reads as a tactile control that is greener and clearer than a checkmark. On shows a green switch flipped right with an On label, off shows a gray switch flipped left.
Required Columns
| Display name | Column type | Internal name |
|---|---|---|
| Account | Single line of text | [Title] |
| Active | Yes/No | [Active] |
Prerequisites
- Build a list with a yes/no column before you paste the JSON.
- Then populate the list, setting each row to yes or no.
- Because the JSON is applied at the column level, the yes/no column can use any name you want.
- The on and off colors and labels live in the JSON – change them to match your wording.
- The JSON checks for both a boolean value and the text Yes that some tenants return – keep both checks unless your tenant is confirmed to return only boolean Yes/No values.
JSON Instructions
- On the Active column, open the column header menu, choose Column settings, then Format this column.
- Switch to Advanced mode.
- Paste the JSON below and click Save.
{
  "$schema": "https://developer.microsoft.com/json-schemas/sp/v2/column-formatting.schema.json",
  "elmType": "div",
  "style": {
    "display": "inline-flex",
    "align-items": "center",
    "gap": "8px"
  },
  "children": [
    {
      "elmType": "div",
      "style": {
        "width": "40px",
        "height": "22px",
        "border-radius": "14px",
        "position": "relative",
        "background-color": "=if(@currentField == true || toString(@currentField) == 'Yes', '#0f7a3d', '#c8c6c4')"
      },
      "children": [
        {
          "elmType": "div",
          "style": {
            "position": "absolute",
            "top": "2px",
            "width": "18px",
            "height": "18px",
            "border-radius": "50%",
            "background-color": "#ffffff",
            "box-shadow": "0 1px 2px rgba(0,0,0,0.3)",
            "left": "=if(@currentField == true || toString(@currentField) == 'Yes', '20px', '2px')"
          }
        }
      ]
    },
    {
      "elmType": "span",
      "txtContent": "=if(@currentField == true || toString(@currentField) == 'Yes', 'On', 'Off')",
      "style": {
        "font-size": "12px",
        "font-weight": "600",
        "color": "=if(@currentField == true || toString(@currentField) == 'Yes', '#0f7a3d', '#605e5c')"
      }
    }
  ]
}Signal-Bar Level
Shows a one-to-five rating as a row of filled segments, so skill, difficulty, or intensity reads as a quick bar rather than a number – a cleaner, more compact look than stars. The segments fill up to the value, and the count and colors are easy to change.
Required Columns
| Display name | Column type | Internal name |
|---|---|---|
| Skill | Single line of text | [Title] |
| Level | Number | [Level] |
Prerequisites
- Build a list with these columns before you paste the JSON.
- Then populate the list with values from 1 to 5.
- Because the JSON is applied at the column level, the Level column can use any name you want.
- The segment count and the filled and empty colors live in the JSON – change them for a different scale or look.
- The meter is built for a 1 to 5 range, filling one segment per level.
JSON Instructions
- On the Level column, open the column header menu, choose Column settings, then Format this column.
- Switch to Advanced mode.
- Paste the JSON below and click Save.
{
  "$schema": "https://developer.microsoft.com/json-schemas/sp/v2/column-formatting.schema.json",
  "elmType": "div",
  "style": {
    "display": "flex",
    "align-items": "center",
    "height": "100%",
    "gap": "3px"
  },
  "children": [
    {
      "elmType": "div",
      "style": {
        "width": "16px",
        "height": "13px",
        "border-radius": "2px",
        "background-color": "=if(Number(@currentField) > 0, '#0f6cbd', '#c8c6c4')"
      }
    },
    {
      "elmType": "div",
      "style": {
        "width": "16px",
        "height": "13px",
        "border-radius": "2px",
        "background-color": "=if(Number(@currentField) > 1, '#0f6cbd', '#c8c6c4')"
      }
    },
    {
      "elmType": "div",
      "style": {
        "width": "16px",
        "height": "13px",
        "border-radius": "2px",
        "background-color": "=if(Number(@currentField) > 2, '#0f6cbd', '#c8c6c4')"
      }
    },
    {
      "elmType": "div",
      "style": {
        "width": "16px",
        "height": "13px",
        "border-radius": "2px",
        "background-color": "=if(Number(@currentField) > 3, '#0f6cbd', '#c8c6c4')"
      }
    },
    {
      "elmType": "div",
      "style": {
        "width": "16px",
        "height": "13px",
        "border-radius": "2px",
        "background-color": "=if(Number(@currentField) > 4, '#0f6cbd', '#c8c6c4')"
      }
    }
  ]
}Neon Glow Badge
Shows a status as a dark chip with a glowing colored outline, giving standout states a cyberpunk, dashboard-at-night look that pulls the eye. Each status gets its own glow color, with the word bright against a dark pill.
Required Columns
| Display name | Column type | Internal name |
|---|---|---|
| Channel | Single line of text | [Title] |
| Status | Choice | [Status] |
Prerequisites
- Build a list with a choice column for the status before you paste the JSON.
- Then populate the list with status values.
- The JSON keys off specific words (Live, Priority, Online, Standby); use these exact words in your choice column or edit the words in the JSON to match yours.
- Apply the formatting to the status column.
JSON Instructions
- On the Status column, open the column header menu, choose Column settings, then Format this column.
- Switch to Advanced mode.
- Paste the JSON below and click Save.
{
  "$schema": "https://developer.microsoft.com/json-schemas/sp/v2/column-formatting.schema.json",
  "elmType": "div",
  "style": {
    "display": "flex",
    "align-items": "center",
    "height": "100%",
    "box-sizing": "border-box"
  },
  "children": [
    {
      "elmType": "span",
      "txtContent": "@currentField",
      "style": {
        "display": "inline-flex",
        "align-items": "center",
        "justify-content": "center",
        "box-sizing": "border-box",
        "width": "82px",
        "height": "24px",
        "padding": "0 8px",
        "border-radius": "12px",
        "font-size": "12px",
        "font-weight": "700",
        "letter-spacing": "0.4px",
        "line-height": "1",
        "white-space": "nowrap",
        "background-color": "#0b1020",
        "color": "=if(@currentField == 'Live', '#7df9ff', if(@currentField == 'Priority', '#ff9ae0', if(@currentField == 'Online', '#a7f3d0', '#c7d2fe')))",
        "border": "1.5px solid",
        "border-color": "=if(@currentField == 'Live', '#22d3ee', if(@currentField == 'Priority', '#ec4899', if(@currentField == 'Online', '#34d399', '#818cf8')))",
        "box-shadow": "=if(@currentField == 'Live', '0 0 8px rgba(34,211,238,0.8), inset 0 0 6px rgba(34,211,238,0.35)', if(@currentField == 'Priority', '0 0 8px rgba(236,72,153,0.8), inset 0 0 6px rgba(236,72,153,0.35)', if(@currentField == 'Online', '0 0 8px rgba(52,211,153,0.8), inset 0 0 6px rgba(52,211,153,0.35)', '0 0 8px rgba(129,140,248,0.8), inset 0 0 6px rgba(129,140,248,0.35)')))"
      }
    }
  ]
}Emoji Rating Face
Maps a status or mood word to a friendly emoji face and a matching color, so feedback, health, or satisfaction reads at a glance rather than as plain text. Positive shows a smiling green face, neutral an even amber face, and negative a frowning red one, with the word kept beside it.
Required Columns
| Display name | Column type | Internal name |
|---|---|---|
| Response | Single line of text | [Title] |
| Sentiment | Choice | [Sentiment] |
Prerequisites
- Build a list with a choice column before you paste the JSON.
- Then populate the list with sentiment values.
- The JSON keys off specific words (Positive, Neutral, Negative, Mixed); use these exact words in your choice column or edit the words in the JSON to match yours (a neutral face covers the rest).
- Apply the formatting to the sentiment column.
JSON Instructions
- On the Sentiment column, open the column header menu, choose Column settings, then Format this column.
- Switch to Advanced mode.
- Paste the JSON below and click Save.
{
  "$schema": "https://developer.microsoft.com/json-schemas/sp/v2/column-formatting.schema.json",
  "elmType": "div",
  "style": {
    "display": "inline-flex",
    "align-items": "center",
    "gap": "9px"
  },
  "children": [
    {
      "elmType": "span",
      "txtContent": "=if(@currentField == 'Positive', '😊', if(@currentField == 'Neutral', '😐', if(@currentField == 'Negative', '🙁', if(@currentField == 'Mixed', '😕', '💬'))))",
      "style": {
        "font-size": "22px",
        "line-height": "1"
      }
    },
    {
      "elmType": "span",
      "txtContent": "@currentField",
      "style": {
        "font-size": "15px",
        "font-weight": "700",
        "color": "=if(@currentField == 'Positive', '#007a5a', if(@currentField == 'Neutral', '#9a6f00', if(@currentField == 'Negative', '#d13438', '#4f4f4f')))"
      }
    }
  ]
}Change Indicator
Shows a number together with how it changed, pairing the current value with a small green or red pill that reads the movement against a prior or target value – up twelve percent, down five percent – so a column of figures tells its own story at a glance. Gains show a green up chip and drops show a red down chip, the percent is rounded for a clean read, and a row with no prior value simply shows the number on its own.
Required Columns
| Display name | Column type | Internal name |
|---|---|---|
| Region | Single line of text | [Title] |
| This Month | Number | [ThisMonth] |
| Previous | Number | [Previous] |
| Updated | Date and time | [Updated] |
Prerequisites
- Build a list with these columns before you paste the JSON.
- Then populate each row with a current value and its prior value.
- The JSON reads the prior value from the Previous column, so its internal name in brackets must match the JSON exactly – or rename [$Previous] in the JSON to your own column.
- Apply the formatting to the current-value column, not to the Previous column.
- The indicator handles comma-formatted numbers and hides itself when the Previous value is blank or zero.
JSON Instructions
- On the This Month column, open the column header menu, choose Column settings, then Format this column.
- Switch to Advanced mode.
- Paste the JSON below and click Save.
{
  "$schema": "https://developer.microsoft.com/json-schemas/sp/v2/column-formatting.schema.json",
  "elmType": "div",
  "style": {
    "display": "flex",
    "align-items": "center",
    "justify-content": "space-between",
    "width": "100%",
    "gap": "18px",
    "box-sizing": "border-box",
    "padding-right": "8px"
  },
  "children": [
    {
      "elmType": "span",
      "txtContent": "=if(@currentField == '', '-', @currentField)",
      "style": {
        "font-weight": "600",
        "color": "#201f1e",
        "white-space": "nowrap"
      }
    },
    {
      "elmType": "span",
      "txtContent": "=if(if(@currentField == '', false, if([$Previous] == '', false, if(Number(replaceAll(toString([$Previous]), ',', '')) == 0, false, true))), if((Number(replaceAll(toString(@currentField), ',', '')) - Number(replaceAll(toString([$Previous]), ',', ''))) >= 0, '▲ +', '▼ -') + floor(abs((Number(replaceAll(toString(@currentField), ',', '')) - Number(replaceAll(toString([$Previous]), ',', ''))) / Number(replaceAll(toString([$Previous]), ',', '')) * 100) + 0.5) + '%', '')",
      "style": {
        "display": "=if(if(@currentField == '', false, if([$Previous] == '', false, if(Number(replaceAll(toString([$Previous]), ',', '')) == 0, false, true))), 'inline-flex', 'none')",
        "align-items": "center",
        "justify-content": "center",
        "font-size": "13px",
        "font-weight": "700",
        "padding": "2px 9px",
        "border-radius": "12px",
        "white-space": "nowrap",
        "color": "=if((Number(replaceAll(toString(@currentField), ',', '')) - Number(replaceAll(toString([$Previous]), ',', ''))) >= 0, '#0f7a3d', '#c1352b')",
        "background-color": "=if((Number(replaceAll(toString(@currentField), ',', '')) - Number(replaceAll(toString([$Previous]), ',', ''))) >= 0, '#e7f5ee', '#fdeaea')"
      }
    }
  ]
}Category Tags
Render a multi-choice column as a tidy row of rounded, color-coded chips instead of a run of comma-separated text, so a list of skills, tags, or categories reads cleanly and by color. Each value becomes its own chip, colored by a small map in the JSON, with a neutral chip for anything unmapped.
Required Columns
| Display name | Column type | Internal name |
|---|---|---|
| Person | Single line of text | [Title] |
| Skills | Choice | [Skills] |
Prerequisites
- Build a list with a choice column that allows multiple selections before you paste the JSON.
- Then populate the list, choosing one or more values per row.
- The JSON colors specific values by name; use these words in your choice column or edit the color map in the JSON to match yours (a neutral chip covers the rest).
- Apply the formatting to the multi-choice column.
- Dedicated colors are mapped only for React, Azure, SQL, Design, Figma, Python, and Excel, and the values are case-sensitive – every other value falls back to a neutral chip.
JSON Instructions
- On the Skills column, open the column header menu, choose Column settings, then Format this column.
- Switch to Advanced mode.
- Paste the JSON below and click Save.
{
  "$schema": "https://developer.microsoft.com/json-schemas/sp/v2/column-formatting.schema.json",
  "elmType": "div",
  "style": {
    "display": "flex",
    "flex-wrap": "wrap",
    "align-items": "center",
    "padding": "3px 0"
  },
  "children": [
    {
      "forEach": "tag in @currentField",
      "elmType": "span",
      "txtContent": "[$tag]",
      "style": {
        "display": "inline-flex",
        "align-items": "center",
        "justify-content": "center",
        "box-sizing": "border-box",
        "min-width": "64px",
        "min-height": "28px",
        "padding": "4px 12px",
        "margin": "3px 6px 3px 0",
        "border-radius": "8px",
        "border-style": "solid",
        "border-width": "1px",
        "font-size": "14px",
        "font-weight": "600",
        "line-height": "20px",
        "white-space": "nowrap",
        "background-color": "=if([$tag] == 'React', '#e0e7ff', if([$tag] == 'Azure', '#dcfce7', if([$tag] == 'SQL', '#fef3c7', if([$tag] == 'Design', '#fce7f3', if([$tag] == 'Figma', '#e0f2fe', if([$tag] == 'Python', '#ede9fe', if([$tag] == 'Excel', '#dcfce7', '#eef0f2')))))))",
        "border-color": "=if([$tag] == 'React', '#c7d2fe', if([$tag] == 'Azure', '#bbf7d0', if([$tag] == 'SQL', '#fde68a', if([$tag] == 'Design', '#fbcfe8', if([$tag] == 'Figma', '#bae6fd', if([$tag] == 'Python', '#ddd6fe', if([$tag] == 'Excel', '#bbf7d0', '#d2d0ce')))))))",
        "color": "=if([$tag] == 'React', '#3730a3', if([$tag] == 'Azure', '#166534', if([$tag] == 'SQL', '#92400e', if([$tag] == 'Design', '#9d174d', if([$tag] == 'Figma', '#075985', if([$tag] == 'Python', '#5b21b6', if([$tag] == 'Excel', '#166534', '#3b3a39')))))))"
      }
    }
  ]
}Health Traffic Light
Turns a plain health score into the universally understood red, amber, or green signal, so anyone scanning a SharePoint list knows what needs attention without reading the number. A compact three-lamp traffic light lights exactly one lamp based on the value – green for healthy, amber for at risk, red for critical – next to a short health word and the score, and a blank value falls back to an unlit light labeled No data.
Required Columns
| Display name | Column type | Internal name |
|---|---|---|
| Title | Single line of text | [Title] |
| Health | Number | [Health] |
| Owner | Person or Group | [Owner] |
| Checked | Date and time | [Checked] |
Prerequisites
- Build a list with these columns before you paste the JSON.
- Then populate the list with data.
- Because the JSON is applied at the column level, the Health column can use any name you want.
- Make the Health column a Number, with values from 0 to 100.
- If you like, change the 80 and 50 thresholds in the JSON yourself to set your own green, amber, and red bands.
JSON Instructions
- On the Health column, open the column header menu, choose Column settings, then Format this column.
- Switch to Advanced mode.
- Paste the JSON below and click Save.
{
  "$schema": "https://developer.microsoft.com/json-schemas/sp/v2/column-formatting.schema.json",
  "elmType": "div",
  "style": {
    "display": "inline-flex",
    "align-items": "center"
  },
  "children": [
    {
      "elmType": "div",
      "style": {
        "display": "inline-flex",
        "flex-direction": "column",
        "align-items": "center",
        "justify-content": "center",
        "gap": "3px",
        "box-sizing": "border-box",
        "padding": "4px 4px",
        "border-radius": "5px",
        "background-color": "#605e5c"
      },
      "children": [
        {
          "elmType": "div",
          "style": {
            "width": "9px",
            "height": "9px",
            "border-radius": "50%",
            "background-color": "=if(@currentField == '', '#3b3a39', if(Number(@currentField) < 50, '#d13438', '#3b3a39'))"
          }
        },
        {
          "elmType": "div",
          "style": {
            "width": "9px",
            "height": "9px",
            "border-radius": "50%",
            "background-color": "=if(@currentField == '', '#3b3a39', if(Number(@currentField) >= 50 && Number(@currentField) < 80, '#ffb900', '#3b3a39'))"
          }
        },
        {
          "elmType": "div",
          "style": {
            "width": "9px",
            "height": "9px",
            "border-radius": "50%",
            "background-color": "=if(@currentField == '', '#3b3a39', if(Number(@currentField) >= 80, '#2aa745', '#3b3a39'))"
          }
        }
      ]
    },
    {
      "elmType": "div",
      "style": {
        "display": "inline-flex",
        "flex-direction": "column",
        "margin-left": "9px",
        "line-height": "1.2"
      },
      "children": [
        {
          "elmType": "span",
          "style": {
            "font-size": "13px",
            "font-weight": "700",
            "color": "=if(@currentField == '', '#605e5c', if(Number(@currentField) >= 80, '#008a00', if(Number(@currentField) >= 50, '#8a6d00', '#c50f1f')))"
          },
          "txtContent": "=if(@currentField == '', 'No data', if(Number(@currentField) >= 80, 'Healthy', if(Number(@currentField) >= 50, 'At Risk', 'Critical')))"
        },
        {
          "elmType": "span",
          "style": {
            "font-size": "12px",
            "font-weight": "500",
            "color": "#323130"
          },
          "txtContent": "=if(@currentField == '', '', 'Health ' + @currentField)"
        }
      ]
    }
  ]
}Overdue Flag
Turns a plain due-date column into a live deadline indicator, so anyone scanning a SharePoint list can see at a glance what is past due or coming up fast. The flag reads the date against today: items past their date show a red Overdue flag, items due within three days show an amber Due soon flag, and everything else shows the date plainly – and because it reads the current column and the current date, it stays accurate every day with no maintenance.
Required Columns
| Display name | Column type | Internal name |
|---|---|---|
| Title | Single line of text | [Title] |
| Due Date | Date and time | [Due Date] |
| Assigned To | Person or Group | [Assigned To] |
| Status | Choice | [Status] |
Prerequisites
- Build a list with these columns before you paste the JSON.
- Populate the list with data.
- Because the JSON is applied at the column level, the Due Date column can use any name you want.
- Items past their date are flagged Overdue and items due within three days are flagged Due soon – change the three-day window (259200000 milliseconds) in the JSON to match your own SLA.
JSON Instructions
- On the Due Date column, open the column header menu, choose Column settings, then Format this column.
- Switch to Advanced mode.
- Paste the JSON below and click Save.
{
  "$schema": "https://developer.microsoft.com/json-schemas/sp/v2/column-formatting.schema.json",
  "elmType": "div",
  "style": {
    "display": "inline-flex",
    "align-items": "center",
    "min-height": "36px",
    "padding": "4px 0",
    "gap": "14px",
    "white-space": "nowrap"
  },
  "children": [
    {
      "elmType": "span",
      "style": {
        "font-size": "15px",
        "font-weight": "700",
        "line-height": "20px",
        "color": "=if(@currentField == '', '#a19f9d', if(floor(Number(Date(@currentField)) / 86400000) < floor(Number(Date(@now)) / 86400000), '#a4262c', if((floor(Number(Date(@currentField)) / 86400000) - floor(Number(Date(@now)) / 86400000)) <= 3, '#8a6d00', '#323130')))"
      },
      "txtContent": "=if(@currentField == '', '-', toLocaleDateString(@currentField))"
    },
    {
      "elmType": "span",
      "style": {
        "display": "=if(@currentField == '', 'none', if(floor(Number(Date(@currentField)) / 86400000) < floor(Number(Date(@now)) / 86400000), 'inline-flex', if((floor(Number(Date(@currentField)) / 86400000) - floor(Number(Date(@now)) / 86400000)) <= 3, 'inline-flex', 'none')))",
        "align-items": "center",
        "justify-content": "center",
        "padding": "3px 11px 3px 8px",
        "border-radius": "10px",
        "font-size": "11px",
        "font-weight": "600",
        "line-height": "14px",
        "color": "#1b1b1b",
        "background-color": "=if(floor(Number(Date(@currentField)) / 86400000) < floor(Number(Date(@now)) / 86400000), '#ff8a8a', '#ffd24d')"
      },
      "children": [
        {
          "elmType": "span",
          "attributes": {
            "iconName": "=if(floor(Number(Date(@currentField)) / 86400000) < floor(Number(Date(@now)) / 86400000), 'Flag', 'Clock')"
          },
          "style": {
            "margin-right": "5px",
            "font-size": "12px",
            "line-height": "12px"
          }
        },
        {
          "elmType": "span",
          "txtContent": "=if(floor(Number(Date(@currentField)) / 86400000) < floor(Number(Date(@now)) / 86400000), 'Overdue', 'Due soon')"
        }
      ]
    }
  ]
}Icon with Text Label
Pairs a status word with a leading icon, so the meaning reads twice – once from the symbol and once from the word – even before color registers. Each status maps to a built-in SharePoint icon and a tinted pill – a check for Complete, a spinner for In Progress, a warning for At Risk, a block for Blocked – and an unmapped value falls back to a neutral information pill.
Required Columns
| Display name | Column type | Internal name |
|---|---|---|
| Title | Single line of text | [Title] |
| Status | Choice | [Status] |
| Owner | Person or Group | [Owner] |
| Due Date | Date and time | [Due Date] |
Prerequisites
- Build a list with these columns before you paste the JSON.
- Populate the list with data.
- Because the JSON is applied at the column level, the Status column can use any name you want.
- It matches each status word to an icon and color by exact text, so edit those short lists in the JSON to fit your own values; anything unmatched shows a neutral information pill.
JSON Instructions
- On the Status column, open the column header menu, choose Column settings, then Format this column.
- Switch to Advanced mode.
- Paste the JSON below and click Save.
{
  "$schema": "https://developer.microsoft.com/json-schemas/sp/v2/column-formatting.schema.json",
  "elmType": "div",
  "style": {
    "display": "flex",
    "align-items": "center",
    "justify-content": "flex-start",
    "box-sizing": "border-box",
    "width": "100%",
    "max-width": "100%",
    "min-height": "34px",
    "padding": "0 10px",
    "border-radius": "8px",
    "overflow": "hidden",
    "background-color": "=if(@currentField == 'Complete', '#e7f3e8', if(@currentField == 'In Progress', '#eaf2fb', if(@currentField == 'At Risk', '#fdf3d6', if(@currentField == 'Blocked', '#fdeceb', if(@currentField == 'Not Started', '#f3f2f1', '#f3f2f1')))))"
  },
  "children": [
    {
      "elmType": "span",
      "attributes": {
        "iconName": "=if(@currentField == 'Complete', 'CompletedSolid', if(@currentField == 'In Progress', 'Sync', if(@currentField == 'At Risk', 'Warning', if(@currentField == 'Blocked', 'Blocked', if(@currentField == 'Not Started', 'CircleRing', 'Info')))))"
      },
      "style": {
        "font-size": "13px",
        "line-height": "1",
        "margin-right": "8px",
        "flex-shrink": "0",
        "color": "=if(@currentField == 'Complete', '#0b6a0b', if(@currentField == 'In Progress', '#0b5cab', if(@currentField == 'At Risk', '#7a5c00', if(@currentField == 'Blocked', '#a4262c', if(@currentField == 'Not Started', '#605e5c', '#605e5c')))))"
      }
    },
    {
      "elmType": "span",
      "txtContent": "=if(@currentField == '', 'Not set', @currentField)",
      "style": {
        "font-size": "13px",
        "font-weight": "600",
        "line-height": "1.2",
        "white-space": "nowrap",
        "overflow": "hidden",
        "text-overflow": "ellipsis",
        "color": "=if(@currentField == 'Complete', '#0b6a0b', if(@currentField == 'In Progress', '#0b5cab', if(@currentField == 'At Risk', '#7a5c00', if(@currentField == 'Blocked', '#a4262c', if(@currentField == 'Not Started', '#605e5c', '#605e5c')))))"
      }
    }
  ]
}Priority Badge
Turns a plain priority column into an at-a-glance level indicator that deepens in color as urgency rises, so anyone scanning a SharePoint list can spot the Critical items instantly. The badge pairs a heat-ramp color – green for Low through to red for Critical – with small signal bars that fill up with the level, and because it reads the current column, you can drop it on any priority or severity field across your sites.
Required Columns
| Display name | Column type | Internal name |
|---|---|---|
| Title | Single line of text | [Title] |
| Priority | Choice | [Priority] |
| Assigned To | Person or Group | [Assigned To] |
| Due Date | Date and time | [Due Date] |
Prerequisites
- Build a list with these columns before you paste the JSON.
- Populate the list with data.
- Because the JSON is applied at the column level, the Priority column can use any name you want.
- The example recognises Low, Medium, High, and Critical, with a neutral fallback for any other value – adjust those words and colors in the JSON to match your own levels.
JSON Instructions
- On the Priority column, open the column header menu, choose Column settings, then Format this column.
- Switch to Advanced mode.
- Paste the JSON below and click Save.
{
  "$schema": "https://developer.microsoft.com/json-schemas/sp/v2/column-formatting.schema.json",
  "elmType": "div",
  "style": {
    "display": "inline-flex",
    "align-items": "center",
    "justify-content": "center",
    "box-sizing": "border-box",
    "width": "120px",
    "padding": "3px 8px",
    "border-radius": "12px",
    "background-color": "=if(@currentField == 'Critical', '#f8d7da', if(@currentField == 'High', '#ffd8b5', if(@currentField == 'Medium', '#fff2b8', if(@currentField == 'Low', '#e4f2d7', '#f3f2f1'))))"
  },
  "children": [
    {
      "elmType": "div",
      "style": {
        "display": "inline-flex",
        "flex-direction": "row",
        "align-items": "flex-end",
        "height": "15px",
        "margin-right": "7px"
      },
      "children": [
        {
          "elmType": "div",
          "style": {
            "width": "3px",
            "height": "6px",
            "border-radius": "1px",
            "margin-right": "2px",
            "background-color": "=if((@currentField == 'Low' || @currentField == 'Medium' || @currentField == 'High' || @currentField == 'Critical'), if(@currentField == 'Critical', '#b3261e', if(@currentField == 'High', '#c95000', if(@currentField == 'Medium', '#b77900', '#2e7d32'))), '#c8c6c4')"
          }
        },
        {
          "elmType": "div",
          "style": {
            "width": "3px",
            "height": "9px",
            "border-radius": "1px",
            "margin-right": "2px",
            "background-color": "=if((@currentField == 'Medium' || @currentField == 'High' || @currentField == 'Critical'), if(@currentField == 'Critical', '#b3261e', if(@currentField == 'High', '#c95000', '#b77900')), '#c8c6c4')"
          }
        },
        {
          "elmType": "div",
          "style": {
            "width": "3px",
            "height": "12px",
            "border-radius": "1px",
            "margin-right": "2px",
            "background-color": "=if((@currentField == 'High' || @currentField == 'Critical'), if(@currentField == 'Critical', '#b3261e', '#c95000'), '#c8c6c4')"
          }
        },
        {
          "elmType": "div",
          "style": {
            "width": "3px",
            "height": "15px",
            "border-radius": "1px",
            "background-color": "=if(@currentField == 'Critical', '#b3261e', '#c8c6c4')"
          }
        }
      ]
    },
    {
      "elmType": "span",
      "style": {
        "font-size": "13px",
        "font-weight": "600",
        "color": "#242424"
      },
      "txtContent": "@currentField"
    }
  ]
}Approval Stamp
Turns a plain approval or status column into a bold, rubber-stamp-style mark, so anyone scanning a SharePoint list can see at a glance whether an item is Approved, Rejected, or still pending. The stamp shows the status word in uppercase inside a colored outline with a matching icon – green for approved, red for rejected, amber for pending – and because it reads the current column, you can drop it on any status field across your sites.
Required Columns
| Display name | Column type | Internal name |
|---|---|---|
| Title | Single line of text | [Title] |
| Approval Status | Choice | [Approval Status] |
| Requested By | Person or Group | [Requested By] |
| Decision Date | Date and time | [Decision Date] |
Prerequisites
- Build a list with these columns before you paste the JSON.
- Populate the list with data.
- Because the JSON is applied at the column level, the Approval Status column can use any name you want.
- The example recognizes Approved, Rejected, Pending, and In Review, with a neutral fallback for any other value – adjust those words in the JSON to match your own choices.
JSON Instructions
- On the Approval Status column, open the column header menu, choose Column settings, then Format this column.
- Switch to Advanced mode.
- Paste the JSON below and click Save.
{
  "$schema": "https://developer.microsoft.com/json-schemas/sp/v2/column-formatting.schema.json",
  "elmType": "div",
  "style": {
    "display": "inline-flex",
    "align-items": "center",
    "box-sizing": "border-box",
    "justify-content": "center",
    "min-width": "128px",
    "width": "fit-content",
    "max-width": "100%",
    "height": "30px",
    "min-height": "30px",
    "max-height": "30px",
    "padding": "0 8px",
    "margin": "5px 0",
    "border-radius": "5px",
    "font-size": "12px",
    "line-height": "14px",
    "font-weight": "700",
    "letter-spacing": "0.55px",
    "text-transform": "uppercase",
    "overflow": "hidden",
    "border": "='1px solid ' + if(@currentField == 'Approved', '#107c10', if(@currentField == 'Rejected', '#a4262c', if(@currentField == 'Pending', '#8a6d00', if(@currentField == 'In Review', '#005a9e', '#797775'))))",
    "color": "=if(@currentField == 'Approved', '#107c10', if(@currentField == 'Rejected', '#a4262c', if(@currentField == 'Pending', '#8a6d00', if(@currentField == 'In Review', '#005a9e', '#797775'))))",
    "background-color": "=if(@currentField == 'Approved', '#eaf3de', if(@currentField == 'Rejected', '#fdeceb', if(@currentField == 'Pending', '#fdf3d6', if(@currentField == 'In Review', '#e6f1fb', '#f3f2f1'))))"
  },
  "children": [
    {
      "elmType": "span",
      "attributes": {
        "iconName": "=if(@currentField == 'Approved', 'Accept', if(@currentField == 'Rejected', 'Cancel', if(@currentField == 'Pending', 'Clock', if(@currentField == 'In Review', 'View', 'Unknown'))))"
      },
      "style": {
        "margin-right": "5px",
        "font-size": "11px",
        "line-height": "11px",
        "flex-shrink": "0"
      }
    },
    {
      "elmType": "span",
      "style": {
        "line-height": "14px",
        "white-space": "nowrap",
        "overflow": "hidden",
        "text-overflow": "ellipsis",
        "min-width": "0"
      },
      "txtContent": "@currentField"
    }
  ]
}Yes/No Badge
Turns a plain true or false value into a familiar toggle switch, so a setting reads as on or off at a glance instead of as a word. The switch shows green with the knob to the right when the value is on – Yes, Active, On, or Enabled – and gray with the knob to the left when it is off, and the matching label sits beside it.
Required Columns
| Display name | Column type | Internal name |
|---|---|---|
| Title | Single line of text | [Title] |
| Enabled | Yes/No | [Enabled] |
| Owner | Person or Group | [Owner] |
| Updated | Date and time | [Updated] |
Prerequisites
- Build a list with these columns before you paste the JSON.
- Populate the list with data.
- Because the JSON is applied at the column level, the Enabled column can use any name you want.
- It also reads the words Yes, Active, On, and Enabled as on, so the same JSON works on a two-value choice column; anything else reads as off.
JSON Instructions
- On the Enabled column, open the column header menu, choose Column settings, then Format this column.
- Switch to Advanced mode.
- Paste the JSON below and click Save.
{
  "$schema": "https://developer.microsoft.com/json-schemas/sp/v2/column-formatting.schema.json",
  "elmType": "div",
  "style": {
    "display": "inline-flex",
    "align-items": "center"
  },
  "children": [
    {
      "elmType": "div",
      "style": {
        "display": "flex",
        "align-items": "center",
        "box-sizing": "border-box",
        "width": "32px",
        "height": "18px",
        "border-radius": "9px",
        "padding": "0 2px",
        "justify-content": "=if((@currentField == true || @currentField == 'Yes' || @currentField == 'Active' || @currentField == 'On' || @currentField == 'Enabled' || @currentField == 'True' || @currentField == '1'), 'flex-end', 'flex-start')",
        "background-color": "=if(@currentField == '', '#edebe9', if((@currentField == true || @currentField == 'Yes' || @currentField == 'Active' || @currentField == 'On' || @currentField == 'Enabled' || @currentField == 'True' || @currentField == '1'), '#107c10', '#c8c6c4'))"
      },
      "children": [
        {
          "elmType": "div",
          "style": {
            "width": "14px",
            "height": "14px",
            "border-radius": "50%",
            "background-color": "#ffffff"
          }
        }
      ]
    },
    {
      "elmType": "span",
      "style": {
        "margin-left": "8px",
        "font-size": "12px",
        "font-weight": "600",
        "color": "=if(@currentField == '', '#8a8886', if((@currentField == true || @currentField == 'Yes' || @currentField == 'Active' || @currentField == 'On' || @currentField == 'Enabled' || @currentField == 'True' || @currentField == '1'), '#107c10', '#605e5c'))"
      },
      "txtContent": "=if(@currentField == true, 'Yes', if(@currentField == false, 'No', if(@currentField == '', 'Not set', @currentField)))"
    }
  ]
}Mini Column Chart
Draws a tiny bar chart inside a single SharePoint cell, so each row shows its own four-quarter trend at a glance instead of four separate number columns. Each bar is scaled to that row’s own highest value and the tallest bar is highlighted, so you can spot the peak quarter and compare periods within a row instantly – all without any custom development.
Required Columns
| Display name | Column type | Internal name |
|---|---|---|
| Chart | Single line of text | [Chart] |
| Q1 | Number | [Q1] |
| Q2 | Number | [Q2] |
| Q3 | Number | [Q3] |
| Q4 | Number | [Q4] |
Prerequisites
- Build a list with these columns before you paste the JSON.
- Then fill in the four quarter numbers per row – leave the Chart column empty, as it only hosts the bars.
- Internal column names (in brackets) must match the JSON exactly.
- Each row’s bars scale to that row’s own highest value, so rows with different totals still read clearly.
- The verified JSON references the internal names _x0051_1, _x0051_2, _x0051_3, and _x0051_4 – the names SharePoint generated for the Q1 to Q4 columns in the tested list.
- Before deploying, open each quarter column’s settings and check the Field= value in the browser address; if the client’s internal names differ, replace the four field references in the JSON before saving.
- Fill in all four numbers before applying – the tallest value is highlighted, and tied highest values may all take the highlight color.
JSON Instructions
- Select the Chart column header, then Column settings, then Format this column.
- Switch to Advanced mode.
- Paste the JSON below and click Save.
- Widen the Chart column so all four bars have room.
{
  "$schema": "https://developer.microsoft.com/json-schemas/sp/v2/column-formatting.schema.json",
  "elmType": "div",
  "style": {
    "display": "flex",
    "align-items": "center",
    "height": "96px",
    "overflow": "hidden"
  },
  "children": [
    {
      "elmType": "div",
      "style": {
        "display": "flex",
        "align-items": "flex-end",
        "gap": "14px",
        "height": "80px",
        "padding": "0 12px 0 28px"
      },
      "children": [
        {
          "elmType": "div",
          "style": {
            "display": "flex",
            "flex-direction": "column",
            "align-items": "center",
            "justify-content": "flex-end",
            "height": "80px",
            "gap": "3px"
          },
          "children": [
            {
              "elmType": "div",
              "style": {
                "font-size": "11px",
                "line-height": "13px",
                "font-weight": "700",
                "color": "#4f4f4f"
              },
              "txtContent": "=[$_x0051_1]"
            },
            {
              "elmType": "div",
              "style": {
                "width": "22px",
                "min-height": "2px",
                "border-radius": "3px 3px 0 0",
                "height": "=(([$_x0051_1] / if(([$_x0051_1]+[$_x0051_2]+[$_x0051_3]+[$_x0051_4]) == 0, 1, if([$_x0051_1] >= [$_x0051_2] && [$_x0051_1] >= [$_x0051_3] && [$_x0051_1] >= [$_x0051_4], [$_x0051_1], if([$_x0051_2] >= [$_x0051_3] && [$_x0051_2] >= [$_x0051_4], [$_x0051_2], if([$_x0051_3] >= [$_x0051_4], [$_x0051_3], [$_x0051_4]))))) * 46) + 'px'",
                "background-color": "=if([$_x0051_1] == if([$_x0051_1] >= [$_x0051_2] && [$_x0051_1] >= [$_x0051_3] && [$_x0051_1] >= [$_x0051_4], [$_x0051_1], if([$_x0051_2] >= [$_x0051_3] && [$_x0051_2] >= [$_x0051_4], [$_x0051_2], if([$_x0051_3] >= [$_x0051_4], [$_x0051_3], [$_x0051_4]))), '#0f6cbd', '#a9c9e8')"
              }
            },
            {
              "elmType": "div",
              "style": {
                "font-size": "11px",
                "line-height": "14px",
                "font-weight": "600",
                "color": "#4f4f4f"
              },
              "txtContent": "Q1"
            }
          ]
        },
        {
          "elmType": "div",
          "style": {
            "display": "flex",
            "flex-direction": "column",
            "align-items": "center",
            "justify-content": "flex-end",
            "height": "80px",
            "gap": "3px"
          },
          "children": [
            {
              "elmType": "div",
              "style": {
                "font-size": "11px",
                "line-height": "13px",
                "font-weight": "700",
                "color": "#4f4f4f"
              },
              "txtContent": "=[$_x0051_2]"
            },
            {
              "elmType": "div",
              "style": {
                "width": "22px",
                "min-height": "2px",
                "border-radius": "3px 3px 0 0",
                "height": "=(([$_x0051_2] / if(([$_x0051_1]+[$_x0051_2]+[$_x0051_3]+[$_x0051_4]) == 0, 1, if([$_x0051_1] >= [$_x0051_2] && [$_x0051_1] >= [$_x0051_3] && [$_x0051_1] >= [$_x0051_4], [$_x0051_1], if([$_x0051_2] >= [$_x0051_3] && [$_x0051_2] >= [$_x0051_4], [$_x0051_2], if([$_x0051_3] >= [$_x0051_4], [$_x0051_3], [$_x0051_4]))))) * 46) + 'px'",
                "background-color": "=if([$_x0051_2] == if([$_x0051_1] >= [$_x0051_2] && [$_x0051_1] >= [$_x0051_3] && [$_x0051_1] >= [$_x0051_4], [$_x0051_1], if([$_x0051_2] >= [$_x0051_3] && [$_x0051_2] >= [$_x0051_4], [$_x0051_2], if([$_x0051_3] >= [$_x0051_4], [$_x0051_3], [$_x0051_4]))), '#0f6cbd', '#a9c9e8')"
              }
            },
            {
              "elmType": "div",
              "style": {
                "font-size": "11px",
                "line-height": "14px",
                "font-weight": "600",
                "color": "#4f4f4f"
              },
              "txtContent": "Q2"
            }
          ]
        },
        {
          "elmType": "div",
          "style": {
            "display": "flex",
            "flex-direction": "column",
            "align-items": "center",
            "justify-content": "flex-end",
            "height": "80px",
            "gap": "3px"
          },
          "children": [
            {
              "elmType": "div",
              "style": {
                "font-size": "11px",
                "line-height": "13px",
                "font-weight": "700",
                "color": "#4f4f4f"
              },
              "txtContent": "=[$_x0051_3]"
            },
            {
              "elmType": "div",
              "style": {
                "width": "22px",
                "min-height": "2px",
                "border-radius": "3px 3px 0 0",
                "height": "=(([$_x0051_3] / if(([$_x0051_1]+[$_x0051_2]+[$_x0051_3]+[$_x0051_4]) == 0, 1, if([$_x0051_1] >= [$_x0051_2] && [$_x0051_1] >= [$_x0051_3] && [$_x0051_1] >= [$_x0051_4], [$_x0051_1], if([$_x0051_2] >= [$_x0051_3] && [$_x0051_2] >= [$_x0051_4], [$_x0051_2], if([$_x0051_3] >= [$_x0051_4], [$_x0051_3], [$_x0051_4]))))) * 46) + 'px'",
                "background-color": "=if([$_x0051_3] == if([$_x0051_1] >= [$_x0051_2] && [$_x0051_1] >= [$_x0051_3] && [$_x0051_1] >= [$_x0051_4], [$_x0051_1], if([$_x0051_2] >= [$_x0051_3] && [$_x0051_2] >= [$_x0051_4], [$_x0051_2], if([$_x0051_3] >= [$_x0051_4], [$_x0051_3], [$_x0051_4]))), '#0f6cbd', '#a9c9e8')"
              }
            },
            {
              "elmType": "div",
              "style": {
                "font-size": "11px",
                "line-height": "14px",
                "font-weight": "600",
                "color": "#4f4f4f"
              },
              "txtContent": "Q3"
            }
          ]
        },
        {
          "elmType": "div",
          "style": {
            "display": "flex",
            "flex-direction": "column",
            "align-items": "center",
            "justify-content": "flex-end",
            "height": "80px",
            "gap": "3px"
          },
          "children": [
            {
              "elmType": "div",
              "style": {
                "font-size": "11px",
                "line-height": "13px",
                "font-weight": "700",
                "color": "#4f4f4f"
              },
              "txtContent": "=[$_x0051_4]"
            },
            {
              "elmType": "div",
              "style": {
                "width": "22px",
                "min-height": "2px",
                "border-radius": "3px 3px 0 0",
                "height": "=(([$_x0051_4] / if(([$_x0051_1]+[$_x0051_2]+[$_x0051_3]+[$_x0051_4]) == 0, 1, if([$_x0051_1] >= [$_x0051_2] && [$_x0051_1] >= [$_x0051_3] && [$_x0051_1] >= [$_x0051_4], [$_x0051_1], if([$_x0051_2] >= [$_x0051_3] && [$_x0051_2] >= [$_x0051_4], [$_x0051_2], if([$_x0051_3] >= [$_x0051_4], [$_x0051_3], [$_x0051_4]))))) * 46) + 'px'",
                "background-color": "=if([$_x0051_4] == if([$_x0051_1] >= [$_x0051_2] && [$_x0051_1] >= [$_x0051_3] && [$_x0051_1] >= [$_x0051_4], [$_x0051_1], if([$_x0051_2] >= [$_x0051_3] && [$_x0051_2] >= [$_x0051_4], [$_x0051_2], if([$_x0051_3] >= [$_x0051_4], [$_x0051_3], [$_x0051_4]))), '#0f6cbd', '#a9c9e8')"
              }
            },
            {
              "elmType": "div",
              "style": {
                "font-size": "11px",
                "line-height": "14px",
                "font-weight": "600",
                "color": "#4f4f4f"
              },
              "txtContent": "Q4"
            }
          ]
        }
      ]
    }
  ]
}Milestone Tracker
Turns a workflow stage into a row of connected step dots, so anyone can see how far an item has moved through a defined process at a glance. Each named stage maps to a position, the dots and connectors fill up to the current step, and the current stage name shows beside them as Step three of five.
Required Columns
| Display name | Column type | Internal name |
|---|---|---|
| Title | Single line of text | [Title] |
| Phase | Choice | [Phase] |
| Owner | Person or Group | [Owner] |
Prerequisites
- Build a list with these columns before you paste the JSON.
- Populate the list with data.
- The JSON reads a column named Phase ([$Phase]), so the Choice column’s internal name must be Phase – a different internal name leaves the tracker in its Not started fallback state.
- The stage names and their order live in the JSON, so edit that short list to match your own process – add or remove stages and the dot count follows.
- Use these exact Choice values and capitalization: Intake, In Progress, Review, Approved, Complete.
JSON Instructions
- On the Phase column, open the column header menu, choose Column settings, then Format this column.
- Switch to Advanced mode.
- Paste the JSON below and click Save.
{
  "$schema": "https://developer.microsoft.com/json-schemas/sp/v2/column-formatting.schema.json",
  "elmType": "div",
  "style": {
    "display": "flex",
    "flex-direction": "column",
    "align-items": "flex-start",
    "justify-content": "center",
    "width": "100%",
    "min-height": "54px",
    "padding": "4px 0 4px 4px",
    "box-sizing": "border-box"
  },
  "children": [
    {
      "elmType": "div",
      "style": {
        "display": "flex",
        "align-items": "center",
        "justify-content": "flex-start"
      },
      "children": [
        {
          "elmType": "div",
          "style": {
            "width": "14px",
            "height": "14px",
            "border-radius": "50%",
            "flex-shrink": "0",
            "box-sizing": "border-box",
            "border": "=if(1 <= (if([$Phase] == 'Intake', 1, if([$Phase] == 'In Progress', 2, if([$Phase] == 'Review', 3, if([$Phase] == 'Approved', 4, if([$Phase] == 'Complete', 5, 0)))))), '2px solid #0f6cbd', '2px solid #c8c6c4')",
            "background-color": "=if(1 <= (if([$Phase] == 'Intake', 1, if([$Phase] == 'In Progress', 2, if([$Phase] == 'Review', 3, if([$Phase] == 'Approved', 4, if([$Phase] == 'Complete', 5, 0)))))), '#0f6cbd', '#ffffff')"
          }
        },
        {
          "elmType": "div",
          "style": {
            "width": "18px",
            "height": "3px",
            "flex-shrink": "0",
            "background-color": "=if(2 <= (if([$Phase] == 'Intake', 1, if([$Phase] == 'In Progress', 2, if([$Phase] == 'Review', 3, if([$Phase] == 'Approved', 4, if([$Phase] == 'Complete', 5, 0)))))), '#0f6cbd', '#e1e3e6')"
          }
        },
        {
          "elmType": "div",
          "style": {
            "width": "14px",
            "height": "14px",
            "border-radius": "50%",
            "flex-shrink": "0",
            "box-sizing": "border-box",
            "border": "=if(2 <= (if([$Phase] == 'Intake', 1, if([$Phase] == 'In Progress', 2, if([$Phase] == 'Review', 3, if([$Phase] == 'Approved', 4, if([$Phase] == 'Complete', 5, 0)))))), '2px solid #0f6cbd', '2px solid #c8c6c4')",
            "background-color": "=if(2 <= (if([$Phase] == 'Intake', 1, if([$Phase] == 'In Progress', 2, if([$Phase] == 'Review', 3, if([$Phase] == 'Approved', 4, if([$Phase] == 'Complete', 5, 0)))))), '#0f6cbd', '#ffffff')"
          }
        },
        {
          "elmType": "div",
          "style": {
            "width": "18px",
            "height": "3px",
            "flex-shrink": "0",
            "background-color": "=if(3 <= (if([$Phase] == 'Intake', 1, if([$Phase] == 'In Progress', 2, if([$Phase] == 'Review', 3, if([$Phase] == 'Approved', 4, if([$Phase] == 'Complete', 5, 0)))))), '#0f6cbd', '#e1e3e6')"
          }
        },
        {
          "elmType": "div",
          "style": {
            "width": "14px",
            "height": "14px",
            "border-radius": "50%",
            "flex-shrink": "0",
            "box-sizing": "border-box",
            "border": "=if(3 <= (if([$Phase] == 'Intake', 1, if([$Phase] == 'In Progress', 2, if([$Phase] == 'Review', 3, if([$Phase] == 'Approved', 4, if([$Phase] == 'Complete', 5, 0)))))), '2px solid #0f6cbd', '2px solid #c8c6c4')",
            "background-color": "=if(3 <= (if([$Phase] == 'Intake', 1, if([$Phase] == 'In Progress', 2, if([$Phase] == 'Review', 3, if([$Phase] == 'Approved', 4, if([$Phase] == 'Complete', 5, 0)))))), '#0f6cbd', '#ffffff')"
          }
        },
        {
          "elmType": "div",
          "style": {
            "width": "18px",
            "height": "3px",
            "flex-shrink": "0",
            "background-color": "=if(4 <= (if([$Phase] == 'Intake', 1, if([$Phase] == 'In Progress', 2, if([$Phase] == 'Review', 3, if([$Phase] == 'Approved', 4, if([$Phase] == 'Complete', 5, 0)))))), '#0f6cbd', '#e1e3e6')"
          }
        },
        {
          "elmType": "div",
          "style": {
            "width": "14px",
            "height": "14px",
            "border-radius": "50%",
            "flex-shrink": "0",
            "box-sizing": "border-box",
            "border": "=if(4 <= (if([$Phase] == 'Intake', 1, if([$Phase] == 'In Progress', 2, if([$Phase] == 'Review', 3, if([$Phase] == 'Approved', 4, if([$Phase] == 'Complete', 5, 0)))))), '2px solid #0f6cbd', '2px solid #c8c6c4')",
            "background-color": "=if(4 <= (if([$Phase] == 'Intake', 1, if([$Phase] == 'In Progress', 2, if([$Phase] == 'Review', 3, if([$Phase] == 'Approved', 4, if([$Phase] == 'Complete', 5, 0)))))), '#0f6cbd', '#ffffff')"
          }
        },
        {
          "elmType": "div",
          "style": {
            "width": "18px",
            "height": "3px",
            "flex-shrink": "0",
            "background-color": "=if(5 <= (if([$Phase] == 'Intake', 1, if([$Phase] == 'In Progress', 2, if([$Phase] == 'Review', 3, if([$Phase] == 'Approved', 4, if([$Phase] == 'Complete', 5, 0)))))), '#0f6cbd', '#e1e3e6')"
          }
        },
        {
          "elmType": "div",
          "style": {
            "width": "14px",
            "height": "14px",
            "border-radius": "50%",
            "flex-shrink": "0",
            "box-sizing": "border-box",
            "border": "=if(5 <= (if([$Phase] == 'Intake', 1, if([$Phase] == 'In Progress', 2, if([$Phase] == 'Review', 3, if([$Phase] == 'Approved', 4, if([$Phase] == 'Complete', 5, 0)))))), '2px solid #0f6cbd', '2px solid #c8c6c4')",
            "background-color": "=if(5 <= (if([$Phase] == 'Intake', 1, if([$Phase] == 'In Progress', 2, if([$Phase] == 'Review', 3, if([$Phase] == 'Approved', 4, if([$Phase] == 'Complete', 5, 0)))))), '#0f6cbd', '#ffffff')"
          }
        }
      ]
    },
    {
      "elmType": "div",
      "style": {
        "width": "100%",
        "margin-top": "5px",
        "font-size": "12px",
        "font-weight": "600",
        "text-align": "left",
        "white-space": "nowrap",
        "color": "=if((if([$Phase] == 'Intake', 1, if([$Phase] == 'In Progress', 2, if([$Phase] == 'Review', 3, if([$Phase] == 'Approved', 4, if([$Phase] == 'Complete', 5, 0)))))) == 0, '#8a8886', '#3b3a39')"
      },
      "txtContent": "=if((if([$Phase] == 'Intake', 1, if([$Phase] == 'In Progress', 2, if([$Phase] == 'Review', 3, if([$Phase] == 'Approved', 4, if([$Phase] == 'Complete', 5, 0)))))) == 0, 'Not started', [$Phase] + ' · Step ' + (if([$Phase] == 'Intake', 1, if([$Phase] == 'In Progress', 2, if([$Phase] == 'Review', 3, if([$Phase] == 'Approved', 4, if([$Phase] == 'Complete', 5, 0)))))) + ' of 5')"
    }
  ]
}Circular Gauge
Turns a score into a semicircular dial with a target line, so a number reads instantly as how full the gauge is and whether it has reached its goal. The dial fills to match the value, a dark tick marks the target on the arc, and the color shifts as the value meets, approaches, or falls short of the target – green when it is met, amber when it is close, red when it is below.
Required Columns
| Display name | Column type | Internal name |
|---|---|---|
| Title | Single line of text | [Title] |
| Score | Number | [Score] |
| Target | Number | [Target] |
| Owner | Person or Group | [Owner] |
Prerequisites
- Build a list with these columns before you paste the JSON.
- Populate the list with data.
- Because the JSON is applied at the column level, the Score column can use any name you want.
- Score and Target must both be Number columns holding real numeric values, for example 65 and 80.
- If the gauge is blank, confirm the Target column exists, contains a number, and that its internal name matches the JSON reference.
- Keep the outer wrapper in the JSON unchanged – an earlier version stretched the root element to the row height and made the gauge oversized and misaligned.
JSON Instructions
- On the Score column, open the column header menu, choose Column settings, then Format this column.
- Switch to Advanced mode.
- Paste the JSON below and click Save.
{
  "$schema": "https://developer.microsoft.com/json-schemas/sp/v2/column-formatting.schema.json",
  "elmType": "div",
  "style": {
    "position": "relative",
    "width": "108px",
    "height": "62px",
    "min-width": "108px",
    "max-width": "108px",
    "min-height": "62px",
    "max-height": "62px",
    "margin": "0 auto",
    "display": "flex",
    "align-items": "center",
    "justify-content": "center",
    "box-sizing": "border-box"
  },
  "children": [
    {
      "elmType": "svg",
      "attributes": {
        "viewBox": "0 0 100 62",
        "preserveAspectRatio": "xMidYMid meet"
      },
      "style": {
        "width": "100px",
        "height": "60px",
        "display": "=if(@currentField == '', 'none', 'block')"
      },
      "children": [
        {
          "elmType": "path",
          "attributes": {
            "d": "M 8 50 A 42 42 0 0 1 92 50 L 83 50 A 33 33 0 0 0 17 50 Z"
          },
          "style": {
            "fill": "#e8eaed"
          }
        },
        {
          "elmType": "path",
          "attributes": {
            "d": "M 17 50 A 4.5 4.5 0 1 0 8 50 A 4.5 4.5 0 1 0 17 50 Z"
          },
          "style": {
            "fill": "#e8eaed"
          }
        },
        {
          "elmType": "path",
          "attributes": {
            "d": "M 92 50 A 4.5 4.5 0 1 0 83 50 A 4.5 4.5 0 1 0 92 50 Z"
          },
          "style": {
            "fill": "#e8eaed"
          }
        },
        {
          "elmType": "path",
          "attributes": {
            "d": "='M 8 50 A 42 42 0 0 1 ' + (50 + (42 * cos((3.14159265 + (3.14159265 * if(@currentField > 100, 100, if(@currentField < 0, 0, @currentField)) / 100))))) + ' ' + (50 + (42 * sin((3.14159265 + (3.14159265 * if(@currentField > 100, 100, if(@currentField < 0, 0, @currentField)) / 100))))) + ' L ' + (50 + (33 * cos((3.14159265 + (3.14159265 * if(@currentField > 100, 100, if(@currentField < 0, 0, @currentField)) / 100))))) + ' ' + (50 + (33 * sin((3.14159265 + (3.14159265 * if(@currentField > 100, 100, if(@currentField < 0, 0, @currentField)) / 100))))) + ' A 33 33 0 0 0 17 50 Z'"
          },
          "style": {
            "fill": "=if(@currentField >= [$Target], '#107c10', if(@currentField >= ([$Target] * 0.85), '#f7a600', '#d13438'))",
            "display": "=if(@currentField <= 0, 'none', 'block')"
          }
        },
        {
          "elmType": "path",
          "attributes": {
            "d": "M 17 50 A 4.5 4.5 0 1 0 8 50 A 4.5 4.5 0 1 0 17 50 Z"
          },
          "style": {
            "fill": "=if(@currentField >= [$Target], '#107c10', if(@currentField >= ([$Target] * 0.85), '#f7a600', '#d13438'))",
            "display": "=if(@currentField <= 0, 'none', 'block')"
          }
        },
        {
          "elmType": "path",
          "attributes": {
            "d": "='M ' + ((50 + (37.5 * cos((3.14159265 + (3.14159265 * if(@currentField > 100, 100, if(@currentField < 0, 0, @currentField)) / 100))))) + 4.5) + ' ' + (50 + (37.5 * sin((3.14159265 + (3.14159265 * if(@currentField > 100, 100, if(@currentField < 0, 0, @currentField)) / 100))))) + ' A 4.5 4.5 0 1 0 ' + ((50 + (37.5 * cos((3.14159265 + (3.14159265 * if(@currentField > 100, 100, if(@currentField < 0, 0, @currentField)) / 100))))) - 4.5) + ' ' + (50 + (37.5 * sin((3.14159265 + (3.14159265 * if(@currentField > 100, 100, if(@currentField < 0, 0, @currentField)) / 100))))) + ' A 4.5 4.5 0 1 0 ' + ((50 + (37.5 * cos((3.14159265 + (3.14159265 * if(@currentField > 100, 100, if(@currentField < 0, 0, @currentField)) / 100))))) + 4.5) + ' ' + (50 + (37.5 * sin((3.14159265 + (3.14159265 * if(@currentField > 100, 100, if(@currentField < 0, 0, @currentField)) / 100))))) + ' Z'"
          },
          "style": {
            "fill": "=if(@currentField >= [$Target], '#107c10', if(@currentField >= ([$Target] * 0.85), '#f7a600', '#d13438'))",
            "display": "=if(@currentField <= 0, 'none', 'block')"
          }
        },
        {
          "elmType": "path",
          "attributes": {
            "d": "='M ' + (50 + (44 * cos((3.14159265 + (3.14159265 * if([$Target] > 100, 100, if([$Target] < 0, 0, [$Target])) / 100))))) + ' ' + (50 + (44 * sin((3.14159265 + (3.14159265 * if([$Target] > 100, 100, if([$Target] < 0, 0, [$Target])) / 100))))) + ' L ' + (50 + (31 * cos((3.14159265 + (3.14159265 * if([$Target] > 100, 100, if([$Target] < 0, 0, [$Target])) / 100)))) - (1.7 * sin((3.14159265 + (3.14159265 * if([$Target] > 100, 100, if([$Target] < 0, 0, [$Target])) / 100))))) + ' ' + (50 + (31 * sin((3.14159265 + (3.14159265 * if([$Target] > 100, 100, if([$Target] < 0, 0, [$Target])) / 100)))) + (1.7 * cos((3.14159265 + (3.14159265 * if([$Target] > 100, 100, if([$Target] < 0, 0, [$Target])) / 100))))) + ' L ' + (50 + (31 * cos((3.14159265 + (3.14159265 * if([$Target] > 100, 100, if([$Target] < 0, 0, [$Target])) / 100)))) + (1.7 * sin((3.14159265 + (3.14159265 * if([$Target] > 100, 100, if([$Target] < 0, 0, [$Target])) / 100))))) + ' ' + (50 + (31 * sin((3.14159265 + (3.14159265 * if([$Target] > 100, 100, if([$Target] < 0, 0, [$Target])) / 100)))) - (1.7 * cos((3.14159265 + (3.14159265 * if([$Target] > 100, 100, if([$Target] < 0, 0, [$Target])) / 100))))) + ' Z'"
          },
          "style": {
            "fill": "#201f1e",
            "display": "=if([$Target] == '', 'none', 'block')"
          }
        }
      ]
    },
    {
      "elmType": "div",
      "txtContent": "=if(@currentField == '', 'No data', @currentField)",
      "style": {
        "position": "absolute",
        "left": "0",
        "right": "0",
        "top": "26px",
        "text-align": "center",
        "font-size": "17px",
        "font-weight": "700",
        "line-height": "19px",
        "color": "#201f1e"
      }
    },
    {
      "elmType": "div",
      "txtContent": "=if(@currentField == '', '', if([$Target] == '', '', 'target ' + [$Target]))",
      "style": {
        "position": "absolute",
        "left": "0",
        "right": "0",
        "top": "46px",
        "text-align": "center",
        "font-size": "12px",
        "line-height": "13px",
        "font-weight": "500",
        "color": "#605e5c"
      }
    }
  ]
}Bar Gauge
Turns a number into a horizontal bar with a threshold marker, so a value reads as how full the bar is and whether it has crossed a limit. The bar fills to match the value, a dark tick marks the limit from a separate column, and the color shifts as the value approaches and passes that line – green while well under, amber as it nears, red once it goes over.
Required Columns
| Display name | Column type | Internal name |
|---|---|---|
| Title | Single line of text | [Title] |
| Used | Number | [Used] |
| Limit | Number | [Limit] |
| Owner | Person or Group | [Owner] |
Prerequisites
- Build a list with these columns before you paste the JSON.
- Populate the list with data.
- Because the JSON is applied at the column level, the Used column can use any name you want.
JSON Instructions
- On the Used column, open the column header menu, choose Column settings, then Format this column.
- Switch to Advanced mode.
- Paste the JSON below and click Save.
{
  "$schema": "https://developer.microsoft.com/json-schemas/sp/v2/column-formatting.schema.json",
  "elmType": "div",
  "style": {
    "display": "inline-flex",
    "align-items": "center"
  },
  "children": [
    {
      "elmType": "div",
      "style": {
        "position": "relative",
        "box-sizing": "border-box",
        "width": "172px",
        "height": "24px",
        "flex-shrink": "0"
      },
      "children": [
        {
          "elmType": "div",
          "style": {
            "position": "absolute",
            "left": "0px",
            "right": "0px",
            "top": "3px",
            "height": "18px",
            "border-radius": "9px",
            "background-color": "#d8dde3"
          }
        },
        {
          "elmType": "div",
          "style": {
            "position": "absolute",
            "left": "0px",
            "top": "3px",
            "height": "18px",
            "border-radius": "9px",
            "width": "=(if(Number(@currentField) > 100, 100, if(Number(@currentField) < 0, 0, Number(@currentField)))) + '%'",
            "background-color": "=if(@currentField == '', '#d8dde3', if(Number(@currentField) > Number([$Limit]), '#e83b3e', if(Number(@currentField) >= Number([$Limit]) * 0.85, '#f5a000', '#107c10')))"
          }
        },
        {
          "elmType": "div",
          "style": {
            "position": "absolute",
            "top": "0px",
            "height": "24px",
            "width": "2px",
            "border-radius": "1px",
            "background-color": "#323130",
            "left": "=(if(Number([$Limit]) > 100, 100, if(Number([$Limit]) < 0, 0, Number([$Limit])))) + '%'"
          }
        }
      ]
    },
    {
      "elmType": "span",
      "style": {
        "margin-left": "10px",
        "font-size": "14px",
        "font-weight": "600",
        "color": "#201f1e",
        "white-space": "nowrap"
      },
      "txtContent": "=if(@currentField == '', 'No data', @currentField + ' / ' + [$Limit])"
    }
  ]
}Workflow Steps
Shows which stage of a process an item has reached as a row of connected dots, with completed steps filled, the current step glowing, and the rest waiting. The JSON maps each status value to a step, so a request or task reads like a progress tracker instead of a word.
Required Columns
| Display name | Column type | Internal name |
|---|---|---|
| Request | Single line of text | [Title] |
| Stage | Choice | [Stage] |
Prerequisites
- Build a list with a choice column for the stage before you paste the JSON.
- Then populate the list with stage values.
- The JSON keys off specific stage words (Submitted, In Review, Approved, Complete); use these exact words in your choice column or edit the words in the JSON to match yours.
- Apply the formatting to the stage column.
- It renders a fixed four-stage sequence – Submitted, In Review, Approved, Complete – which you extend by adding stages in the JSON.
JSON Instructions
- On the Stage column, open the column header menu, choose Column settings, then Format this column.
- Switch to Advanced mode.
- Paste the JSON below and click Save.
{
  "$schema": "https://developer.microsoft.com/json-schemas/sp/v2/column-formatting.schema.json",
  "elmType": "div",
  "style": {
    "display": "flex",
    "align-items": "center",
    "gap": "0px"
  },
  "children": [
    {
      "elmType": "div",
      "style": {
        "width": "14px",
        "height": "14px",
        "border-radius": "50%",
        "flex-shrink": "0",
        "background-color": "=if((if(@currentField == 'Submitted', 0, if(@currentField == 'In Review', 1, if(@currentField == 'Approved', 2, if(@currentField == 'Complete', 3, -1))))) > 0, '#0f7a3d', if((if(@currentField == 'Submitted', 0, if(@currentField == 'In Review', 1, if(@currentField == 'Approved', 2, if(@currentField == 'Complete', 3, -1))))) == 0, '#0f6cbd', '#c8c6c4'))",
        "box-shadow": "=if((if(@currentField == 'Submitted', 0, if(@currentField == 'In Review', 1, if(@currentField == 'Approved', 2, if(@currentField == 'Complete', 3, -1))))) == 0, '0 0 0 4px rgba(15,108,189,0.20)', 'none')"
      }
    },
    {
      "elmType": "div",
      "style": {
        "width": "22px",
        "height": "3px",
        "flex-shrink": "0",
        "background-color": "=if((if(@currentField == 'Submitted', 0, if(@currentField == 'In Review', 1, if(@currentField == 'Approved', 2, if(@currentField == 'Complete', 3, -1))))) > 0, '#0f7a3d', '#c8c6c4')"
      }
    },
    {
      "elmType": "div",
      "style": {
        "width": "14px",
        "height": "14px",
        "border-radius": "50%",
        "flex-shrink": "0",
        "background-color": "=if((if(@currentField == 'Submitted', 0, if(@currentField == 'In Review', 1, if(@currentField == 'Approved', 2, if(@currentField == 'Complete', 3, -1))))) > 1, '#0f7a3d', if((if(@currentField == 'Submitted', 0, if(@currentField == 'In Review', 1, if(@currentField == 'Approved', 2, if(@currentField == 'Complete', 3, -1))))) == 1, '#0f6cbd', '#c8c6c4'))",
        "box-shadow": "=if((if(@currentField == 'Submitted', 0, if(@currentField == 'In Review', 1, if(@currentField == 'Approved', 2, if(@currentField == 'Complete', 3, -1))))) == 1, '0 0 0 4px rgba(15,108,189,0.20)', 'none')"
      }
    },
    {
      "elmType": "div",
      "style": {
        "width": "22px",
        "height": "3px",
        "flex-shrink": "0",
        "background-color": "=if((if(@currentField == 'Submitted', 0, if(@currentField == 'In Review', 1, if(@currentField == 'Approved', 2, if(@currentField == 'Complete', 3, -1))))) > 1, '#0f7a3d', '#c8c6c4')"
      }
    },
    {
      "elmType": "div",
      "style": {
        "width": "14px",
        "height": "14px",
        "border-radius": "50%",
        "flex-shrink": "0",
        "background-color": "=if((if(@currentField == 'Submitted', 0, if(@currentField == 'In Review', 1, if(@currentField == 'Approved', 2, if(@currentField == 'Complete', 3, -1))))) > 2, '#0f7a3d', if((if(@currentField == 'Submitted', 0, if(@currentField == 'In Review', 1, if(@currentField == 'Approved', 2, if(@currentField == 'Complete', 3, -1))))) == 2, '#0f6cbd', '#c8c6c4'))",
        "box-shadow": "=if((if(@currentField == 'Submitted', 0, if(@currentField == 'In Review', 1, if(@currentField == 'Approved', 2, if(@currentField == 'Complete', 3, -1))))) == 2, '0 0 0 4px rgba(15,108,189,0.20)', 'none')"
      }
    },
    {
      "elmType": "div",
      "style": {
        "width": "22px",
        "height": "3px",
        "flex-shrink": "0",
        "background-color": "=if((if(@currentField == 'Submitted', 0, if(@currentField == 'In Review', 1, if(@currentField == 'Approved', 2, if(@currentField == 'Complete', 3, -1))))) > 2, '#0f7a3d', '#c8c6c4')"
      }
    },
    {
      "elmType": "div",
      "style": {
        "width": "14px",
        "height": "14px",
        "border-radius": "50%",
        "flex-shrink": "0",
        "background-color": "=if((if(@currentField == 'Submitted', 0, if(@currentField == 'In Review', 1, if(@currentField == 'Approved', 2, if(@currentField == 'Complete', 3, -1))))) > 3, '#0f7a3d', if((if(@currentField == 'Submitted', 0, if(@currentField == 'In Review', 1, if(@currentField == 'Approved', 2, if(@currentField == 'Complete', 3, -1))))) == 3, '#0f6cbd', '#c8c6c4'))",
        "box-shadow": "=if((if(@currentField == 'Submitted', 0, if(@currentField == 'In Review', 1, if(@currentField == 'Approved', 2, if(@currentField == 'Complete', 3, -1))))) == 3, '0 0 0 4px rgba(15,108,189,0.20)', 'none')"
      }
    }
  ]
}Target vs Actual Bar
Shows a single metric as a slim bar sitting on shaded poor, ok, and good bands with a target marker, so a reader sees at a glance not just the number but whether it clears the goal. The value bar grows along a 0 to 100 track, the three qualitative bands and the target tick are set in the JSON, and the exact number sits at the end of the bar.
Required Columns
| Display name | Column type | Internal name |
|---|---|---|
| Metric | Single line of text | [Title] |
| Attainment | Number | [Attainment] |
Prerequisites
- Build a list with these columns before you paste the JSON.
- Then populate the list with data on a 0 to 100 scale.
- Because the JSON is applied at the column level, the Attainment column can use any name you want.
- The band splits and the target tick (at 80 percent) live in the JSON – move them to match your own goal.
- Store the value in a Number column on a 0 to 100 scale (a decimal such as 0.73 will not display as 73 percent); the 80 percent target is fixed in the JSON and is not read from a separate Target column.
JSON Instructions
- On the Attainment column, open the column header menu, choose Column settings, then Format this column.
- Switch to Advanced mode.
- Paste the JSON below and click Save.
{
  "$schema": "https://developer.microsoft.com/json-schemas/sp/v2/column-formatting.schema.json",
  "elmType": "div",
  "style": {
    "display": "flex",
    "align-items": "center",
    "height": "100%"
  },
  "children": [
    {
      "elmType": "div",
      "style": {
        "position": "relative",
        "width": "170px",
        "min-width": "170px",
        "max-width": "170px",
        "height": "20px",
        "min-height": "20px",
        "max-height": "20px",
        "border-radius": "4px",
        "overflow": "hidden",
        "background-color": "#f3f2f1"
      },
      "children": [
        {
          "elmType": "div",
          "style": {
            "position": "absolute",
            "left": "0",
            "top": "0",
            "width": "34%",
            "height": "100%",
            "background-color": "#f3b8ae"
          }
        },
        {
          "elmType": "div",
          "style": {
            "position": "absolute",
            "left": "34%",
            "top": "0",
            "width": "33%",
            "height": "100%",
            "background-color": "#f7dd94"
          }
        },
        {
          "elmType": "div",
          "style": {
            "position": "absolute",
            "left": "67%",
            "top": "0",
            "width": "33%",
            "height": "100%",
            "background-color": "#a8d8a3"
          }
        },
        {
          "elmType": "div",
          "style": {
            "position": "absolute",
            "left": "0",
            "top": "30%",
            "height": "40%",
            "border-radius": "3px",
            "background-color": "#2f5fa8",
            "width": "=if(Number(@currentField) < 0, 0, if(Number(@currentField) > 100, 100, Number(@currentField))) + '%'"
          }
        },
        {
          "elmType": "div",
          "style": {
            "position": "absolute",
            "top": "0",
            "left": "80%",
            "width": "3px",
            "height": "100%",
            "background-color": "#1f4480"
          }
        }
      ]
    },
    {
      "elmType": "span",
      "txtContent": "@currentField",
      "style": {
        "margin-left": "8px",
        "font-size": "13px",
        "font-weight": "700",
        "color": "#132a4f"
      }
    }
  ]
}Risk Matrix Cell
Plots each item as a dot inside a small three-by-three red-amber-green grid, positioned by its likelihood and impact, so a risk register reads its hot spots at a glance. The colored grid gives the standard risk heatmap and the dot marks exactly where each row lands.
Required Columns
| Display name | Column type | Internal name |
|---|---|---|
| Risk | Single line of text | [Title] |
| Likelihood | Number | [Likelihood] |
| Impact | Number | [Impact] |
Prerequisites
- Build a list with these columns before you paste the JSON.
- Then populate each row with a likelihood and an impact from 1 to 3.
- The JSON reads likelihood from the Likelihood column, so its internal name in brackets must match the JSON exactly – or rename [$Likelihood] in the JSON to your own column.
- Apply the formatting to the impact column, not to the likelihood column.
- It is designed for Likelihood and Impact values of 1 to 3 only – values outside that range are not supported.
JSON Instructions
- On the Impact column, open the column header menu, choose Column settings, then Format this column.
- Switch to Advanced mode.
- Paste the JSON below and click Save.
{
  "$schema": "https://developer.microsoft.com/json-schemas/sp/v2/column-formatting.schema.json",
  "elmType": "div",
  "style": {
    "position": "relative",
    "width": "52px",
    "height": "52px"
  },
  "children": [
    {
      "elmType": "div",
      "style": {
        "display": "flex",
        "flex-wrap": "wrap",
        "width": "52px",
        "gap": "2px"
      },
      "children": [
        {
          "elmType": "div",
          "style": {
            "width": "16px",
            "height": "16px",
            "border-radius": "2px",
            "background-color": "#86efac"
          }
        },
        {
          "elmType": "div",
          "style": {
            "width": "16px",
            "height": "16px",
            "border-radius": "2px",
            "background-color": "#bbf7d0"
          }
        },
        {
          "elmType": "div",
          "style": {
            "width": "16px",
            "height": "16px",
            "border-radius": "2px",
            "background-color": "#fde68a"
          }
        },
        {
          "elmType": "div",
          "style": {
            "width": "16px",
            "height": "16px",
            "border-radius": "2px",
            "background-color": "#bbf7d0"
          }
        },
        {
          "elmType": "div",
          "style": {
            "width": "16px",
            "height": "16px",
            "border-radius": "2px",
            "background-color": "#fde68a"
          }
        },
        {
          "elmType": "div",
          "style": {
            "width": "16px",
            "height": "16px",
            "border-radius": "2px",
            "background-color": "#fca5a5"
          }
        },
        {
          "elmType": "div",
          "style": {
            "width": "16px",
            "height": "16px",
            "border-radius": "2px",
            "background-color": "#fde68a"
          }
        },
        {
          "elmType": "div",
          "style": {
            "width": "16px",
            "height": "16px",
            "border-radius": "2px",
            "background-color": "#fca5a5"
          }
        },
        {
          "elmType": "div",
          "style": {
            "width": "16px",
            "height": "16px",
            "border-radius": "2px",
            "background-color": "#ef4444"
          }
        }
      ]
    },
    {
      "elmType": "div",
      "style": {
        "display": "=if(if(@currentField == '', false, if([$Likelihood] == '', false, true)), 'block', 'none')",
        "position": "absolute",
        "width": "10px",
        "height": "10px",
        "border-radius": "50%",
        "background-color": "#111827",
        "border": "2px solid #ffffff",
        "left": "=((Number([$Likelihood]) - 1) * 18 + 3) + 'px'",
        "top": "=((3 - Number(@currentField)) * 18 + 3) + 'px'"
      }
    }
  ]
}
Percentage Grid
Turns a percentage into a ten-by-ten block of squares that fill up as the value climbs, so completion reads like a tiny progress picture instead of a number. Each of the hundred squares lights up when the value passes its position, giving a crisp, chart-like read of how far along something is.
Required Columns
| Display name | Column type | Internal name |
|---|---|---|
| Project | Single line of text | [Title] |
| Complete | Number | [Complete] |
Prerequisites
- Build a list with these columns before you paste the JSON.
- Then populate the list with values from 0 to 100.
- Because the JSON is applied at the column level, the Complete column can use any name you want.
- The filled and empty square colors live in the JSON – change them to match your brand.
- Store the value in a Number column on a 0 to 100 scale (a decimal such as 0.73 will not display as 73 percent); the grid uses a compact 10 by 10 layout that stays readable without enlarging the row.
JSON Instructions
- On the Complete column, open the column header menu, choose Column settings, then Format this column.
- Switch to Advanced mode.
- Paste the JSON below and click Save.
{
  "$schema": "https://developer.microsoft.com/json-schemas/sp/v2/column-formatting.schema.json",
  "elmType": "div",
  "style": {
    "display": "flex",
    "flex-wrap": "wrap",
    "width": "79px",
    "gap": "1px"
  },
  "children": [
    {
      "elmType": "div",
      "forEach": "cell in split('0,1,2,3,4,5,6,7,8,9,10,11,12,13,14,15,16,17,18,19,20,21,22,23,24,25,26,27,28,29,30,31,32,33,34,35,36,37,38,39,40,41,42,43,44,45,46,47,48,49,50,51,52,53,54,55,56,57,58,59,60,61,62,63,64,65,66,67,68,69,70,71,72,73,74,75,76,77,78,79,80,81,82,83,84,85,86,87,88,89,90,91,92,93,94,95,96,97,98,99',',')",
      "style": {
        "width": "7px",
        "height": "7px",
        "border-radius": "1px",
        "background-color": "=if(Number([$cell]) < Number(@currentField), '#0f6cbd', '#e3e1df')"
      }
    }
  ]
}Mini Trend Line
Draws a tiny inline bar chart from a handful of history columns, so each row carries its own recent trend without opening a report. The most recent bar is highlighted, so the direction of travel is obvious at a glance.
Required Columns
Prerequisites
- Build a list with these columns before you paste the JSON.
- Then populate each row with a value for every month on a 0 to 100 scale.
- The JSON reads the month columns by name, so their internal names (in brackets) must match the JSON exactly – or edit the names in the JSON to match yours.
- Apply the formatting to any one of the month columns; it draws the whole series.
- It shows six fixed monthly bars, January through June, and highlights June – it does not calculate an actual trend or direction.
JSON Instructions
- On the Jun column, open the column header menu, choose Column settings, then Format this column.
- Switch to Advanced mode.
- Paste the JSON below and click Save.
{
  "$schema": "https://developer.microsoft.com/json-schemas/sp/v2/column-formatting.schema.json",
  "elmType": "div",
  "style": {
    "display": "flex",
    "align-items": "flex-end",
    "gap": "3px",
    "height": "38px",
    "padding": "0 0 0 14px",
    "box-sizing": "border-box"
  },
  "children": [
    {
      "elmType": "div",
      "style": {
        "width": "9px",
        "border-radius": "2px 2px 0 0",
        "align-self": "flex-end",
        "background-color": "#7fb2e0",
        "height": "=(if(Number([$Jan]) < 0, 0, if(Number([$Jan]) > 100, 100, Number([$Jan]))) / 100 * 34) + 'px'"
      }
    },
    {
      "elmType": "div",
      "style": {
        "width": "9px",
        "border-radius": "2px 2px 0 0",
        "align-self": "flex-end",
        "background-color": "#7fb2e0",
        "height": "=(if(Number([$Feb]) < 0, 0, if(Number([$Feb]) > 100, 100, Number([$Feb]))) / 100 * 34) + 'px'"
      }
    },
    {
      "elmType": "div",
      "style": {
        "width": "9px",
        "border-radius": "2px 2px 0 0",
        "align-self": "flex-end",
        "background-color": "#7fb2e0",
        "height": "=(if(Number([$Mar]) < 0, 0, if(Number([$Mar]) > 100, 100, Number([$Mar]))) / 100 * 34) + 'px'"
      }
    },
    {
      "elmType": "div",
      "style": {
        "width": "9px",
        "border-radius": "2px 2px 0 0",
        "align-self": "flex-end",
        "background-color": "#7fb2e0",
        "height": "=(if(Number([$Apr]) < 0, 0, if(Number([$Apr]) > 100, 100, Number([$Apr]))) / 100 * 34) + 'px'"
      }
    },
    {
      "elmType": "div",
      "style": {
        "width": "9px",
        "border-radius": "2px 2px 0 0",
        "align-self": "flex-end",
        "background-color": "#7fb2e0",
        "height": "=(if(Number([$May]) < 0, 0, if(Number([$May]) > 100, 100, Number([$May]))) / 100 * 34) + 'px'"
      }
    },
    {
      "elmType": "div",
      "style": {
        "width": "9px",
        "border-radius": "2px 2px 0 0",
        "align-self": "flex-end",
        "background-color": "#0b3b66",
        "height": "=(if(Number([$Jun]) < 0, 0, if(Number([$Jun]) > 100, 100, Number([$Jun]))) / 100 * 34) + 'px'"
      }
    }
  ]
}Medal Rank
Shows a gold, silver, or bronze medal for the top three rows and a plain number for the rest, so a leaderboard reads its winners at a glance. The top three positions turn into medals and everything else stays a quiet number.
Required Columns
| Display name | Column type | Internal name |
|---|---|---|
| Region | Single line of text | [Title] |
| Rank | Number | [Rank] |
Prerequisites
- Build a list with these columns before you paste the JSON.
- Then populate the list with a rank number per row.
- Because the JSON is applied at the column level, the Rank column can use any name you want.
- How many top places get a medal is set in the JSON – change it to award more or fewer.
JSON Instructions
- On the Rank column, open the column header menu, choose Column settings, then Format this column.
- Switch to Advanced mode.
- Paste the JSON below and click Save.
{
  "$schema": "https://developer.microsoft.com/json-schemas/sp/v2/column-formatting.schema.json",
  "elmType": "div",
  "txtContent": "=if(Number(@currentField) == 1, '🥇', if(Number(@currentField) == 2, '🥈', if(Number(@currentField) == 3, '🥉', @currentField)))",
  "style": {
    "font-size": "=if(Number(@currentField) <= 3, '24px', '14px')",
    "font-weight": "700",
    "text-align": "center",
    "min-width": "28px",
    "color": "=if(Number(@currentField) <= 3, '#201f1e', '#8a8886')",
    "line-height": "1.2",
    "text-shadow": "=if(Number(@currentField) <= 3, '0 0 1px rgba(0,0,0,0.15)', 'none')"
  }
}Heartbeat Line
Draws a heartbeat trace that runs calm and green when things are healthy and spiky and red when they are not, so system health reads like a monitor at a glance. The shape and color of the trace change with the status.
Required Columns
| Display name | Column type | Internal name |
|---|---|---|
| Service | Single line of text | [Title] |
| Vitals | Choice | [Vitals] |
Prerequisites
- Build a list with a choice column for the status before you paste the JSON.
- Then populate the list with status values.
- The JSON keys off specific words (Healthy, Degraded, Critical); use these exact words in your choice column or edit the words in the JSON to match yours.
- Apply the formatting to the status column.
- This is a status illustration, not a live waveform or a historical metric chart.
JSON Instructions
- On the Vitals column, open the column header menu, choose Column settings, then Format this column.
- Switch to Advanced mode.
- Paste the JSON below and click Save.
{
  "$schema": "https://developer.microsoft.com/json-schemas/sp/v2/column-formatting.schema.json",
  "elmType": "svg",
  "attributes": {
    "viewBox": "0 0 150 30",
    "preserveAspectRatio": "xMidYMid meet"
  },
  "style": {
    "width": "150px",
    "height": "30px",
    "display": "block"
  },
  "children": [
    {
      "elmType": "path",
      "attributes": {
        "d": "=if(@currentField == 'Healthy', 'M0 15 H36 L44 6 L50 24 L56 15 H150', 'M0 15 L16 4 L28 26 L40 6 L52 24 L64 8 L76 22 L88 4 L100 26 L112 8 L124 22 L136 6 L150 15')"
      },
      "style": {
        "stroke": "=if(@currentField == 'Healthy', '#0f7a3d', if(@currentField == 'Critical', '#e0523f', '#e8a33d'))",
        "stroke-width": "3px",
        "fill": "none",
        "stroke-linecap": "round",
        "stroke-linejoin": "round"
      }
    }
  ]
}Progress Ring
Draws a percentage as a filled ring with the number in the middle, so completion reads as a clean, chart-like dial. The arc fills to the value and the color shifts as it climbs.
Required Columns
| Display name | Column type | Internal name |
|---|---|---|
| Goal | Single line of text | [Title] |
| Progress | Number | [Progress] |
Prerequisites
- Build a list with these columns before you paste the JSON.
- Then populate the list with values from 0 to 100.
- Because the JSON is applied at the column level, the Progress column can use any name you want.
- The color thresholds live in the JSON – change them to match your own bands.
- Store the value in a Number column on a 0 to 100 scale – a value stored as a decimal such as 0.73 will not display as 73 percent.
JSON Instructions
- On the Progress column, open the column header menu, choose Column settings, then Format this column.
- Switch to Advanced mode.
- Paste the JSON below and click Save.
{
  "$schema": "https://developer.microsoft.com/json-schemas/sp/v2/column-formatting.schema.json",
  "elmType": "div",
  "style": {
    "display": "flex",
    "align-items": "center",
    "justify-content": "center",
    "width": "100%",
    "height": "60px",
    "padding": "6px 0",
    "box-sizing": "border-box"
  },
  "children": [
    {
      "elmType": "div",
      "style": {
        "position": "relative",
        "width": "48px",
        "height": "48px",
        "border-radius": "50%",
        "background-color": "#e3e1df",
        "overflow": "hidden",
        "flex-shrink": "0"
      },
      "children": [
        {
          "elmType": "svg",
          "attributes": {
            "viewBox": "0 0 48 48"
          },
          "style": {
            "position": "absolute",
            "top": "0",
            "left": "0",
            "width": "48px",
            "height": "48px",
            "fill": "=if(Number(@currentField) >= 75, '#0f7a3d', if(Number(@currentField) >= 40, '#0070c9', '#ff6a00'))",
            "display": "=if(@currentField == '', 'none', 'block')"
          },
          "children": [
            {
              "elmType": "path",
              "attributes": {
                "d": "='M24,24 L24,0 A24,24 0 ' + if(Number(@currentField) <= 50, '0', '1') + ',1 ' + toString(24 + (sin(6.2831853 * if(Number(@currentField) >= 100, 99.999, if(Number(@currentField) < 0, 0, Number(@currentField))) / 100) * 24)) + ',' + toString(24 - (cos(6.2831853 * if(Number(@currentField) >= 100, 99.999, if(Number(@currentField) < 0, 0, Number(@currentField))) / 100) * 24)) + ' z'"
              }
            }
          ]
        },
        {
          "elmType": "div",
          "txtContent": "=if(@currentField == '', '-', toString(@currentField) + '%')",
          "style": {
            "position": "absolute",
            "top": "6px",
            "left": "6px",
            "width": "36px",
            "height": "36px",
            "border-radius": "50%",
            "background-color": "#ffffff",
            "display": "flex",
            "align-items": "center",
            "justify-content": "center",
            "font-size": "12px",
            "font-weight": "800",
            "color": "#201f1e"
          }
        }
      ]
    }
  ]
}Color-Scale Cell
Turns a plain number column into an instant thermal map, coloring each value from cool blue at the low end to hot red at the high end so the busiest or riskiest rows jump out without reading a single figure. The color is computed from the value across a smooth fifteen-step blue-to-red scale, the exact number stays visible on the colored chip, and a blank cell falls back to a neutral gray chip so the column never looks broken.
Required Columns
| Display name | Column type | Internal name |
|---|---|---|
| Resource | Single line of text | [Title] |
| Environment | Choice | [Environment] |
| Utilization | Number | [Utilization] |
| Checked | Date and time | [Checked] |
Prerequisites
- Build a list with these columns before you paste the JSON.
- Then populate the list with data.
- Because the JSON is applied at the column level, the Utilization column can use any name you want.
- Make the Utilization column a Number, with values from 0 to 100.
- The color bands live in the JSON – edit the thresholds or the hex colors to match your own scale.
- The formatter uses a compact centered layout so it does not widen the cell or increase the row height.
JSON Instructions
- On the Utilization column, open the column header menu, choose Column settings, then Format this column.
- Switch to Advanced mode.
- Paste the JSON below and click Save.
{
  "$schema": "https://developer.microsoft.com/json-schemas/sp/v2/column-formatting.schema.json",
  "elmType": "div",
  "style": {
    "display": "flex",
    "align-items": "center",
    "justify-content": "center",
    "height": "100%",
    "width": "100%"
  },
  "children": [
    {
      "elmType": "span",
      "txtContent": "=if(@currentField == '', '-', @currentField)",
      "style": {
        "display": "inline-block",
        "box-sizing": "border-box",
        "min-width": "46px",
        "text-align": "center",
        "padding": "2px 10px",
        "border-radius": "6px",
        "font-weight": "600",
        "color": "=if(@currentField == '', '#a19f9d', '#ffffff')",
        "text-shadow": "=if(@currentField == '', 'none', '0 1px 1px rgba(0,0,0,0.35)')",
        "background-color": "=if(@currentField == '', '#f3f2f1', if(Number(@currentField) >= 93.3, '#ca3521', if(Number(@currentField) >= 86.7, '#ca5f21', if(Number(@currentField) >= 80.0, '#ca8821', if(Number(@currentField) >= 73.3, '#cab121', if(Number(@currentField) >= 66.7, '#b9ca21', if(Number(@currentField) >= 60.0, '#90ca21', if(Number(@currentField) >= 53.3, '#66ca21', if(Number(@currentField) >= 46.7, '#3dca21', if(Number(@currentField) >= 40.0, '#21ca2e', if(Number(@currentField) >= 33.3, '#21ca57', if(Number(@currentField) >= 26.7, '#21ca81', if(Number(@currentField) >= 20.0, '#21caaa', if(Number(@currentField) >= 13.3, '#21c0ca', if(Number(@currentField) >= 6.7, '#2197ca', '#216eca')))))))))))))))"
      }
    }
  ]
}Big Number Counter
Turns a plain number into a big, bold dashboard readout on a soft tinted pill, so the figure that matters most in a row reads like a headline. The value is shown large with a small unit label beside it, giving a list the feel of a scoreboard.
Required Columns
| Display name | Column type | Internal name |
|---|---|---|
| Team | Single line of text | [Title] |
| Score | Number | [Score] |
Prerequisites
- Build a list with these columns before you paste the JSON.
- Then populate the list with your numbers.
- Because the JSON is applied at the column level, the Score column can use any name you want.
- The unit label (pts) and the tint color live in the JSON – change them to match your metric.
JSON Instructions
- On the Score column, open the column header menu, choose Column settings, then Format this column.
- Switch to Advanced mode.
- Paste the JSON below and click Save.
{
  "$schema": "https://developer.microsoft.com/json-schemas/sp/v2/column-formatting.schema.json",
  "elmType": "div",
  "style": {
    "display": "flex",
    "align-items": "baseline",
    "justify-content": "center",
    "gap": "6px",
    "width": "124px",
    "box-sizing": "border-box",
    "background-color": "#eef4ff",
    "border": "1px solid #dbeafe",
    "border-radius": "10px",
    "padding": "6px 12px"
  },
  "children": [
    {
      "elmType": "span",
      "txtContent": "=if(@currentField == '', '-', @currentField)",
      "style": {
        "font-size": "22px",
        "font-weight": "800",
        "color": "#0b3b66",
        "letter-spacing": "0.3px"
      }
    },
    {
      "elmType": "span",
      "txtContent": "pts",
      "style": {
        "font-size": "12px",
        "font-weight": "600",
        "color": "#605e5c"
      }
    }
  ]
}Before / After Bar
Places two values on a shared track and joins them with a line, so a before and after, or a start and end, reads as a single clear picture of movement. Both points sit on a 0 to 100 track, the start dot muted and the end dot bold, so the gap between them tells the story.
Required Columns
| Display name | Column type | Internal name |
|---|---|---|
| Team | Single line of text | [Title] |
| Start | Number | [Start] |
| End | Number | [End] |
Prerequisites
- Build a list with these columns before you paste the JSON.
- Then populate each row with a start value and an end value on a 0 to 100 scale.
- The JSON reads the start value from the Start column, so its internal name in brackets must match the JSON exactly – or rename [$Start] in the JSON to your own column.
- Apply the formatting to the end-value column, not to the Start column.
- Store both values in Number columns on a 0 to 100 scale – a value stored as a decimal such as 0.73 will not display as 73 percent.
JSON Instructions
- On the End column, open the column header menu, choose Column settings, then Format this column.
- Switch to Advanced mode.
- Paste the JSON below and click Save.
{
  "$schema": "https://developer.microsoft.com/json-schemas/sp/v2/column-formatting.schema.json",
  "elmType": "div",
  "style": {
    "position": "relative",
    "width": "150px",
    "height": "20px"
  },
  "children": [
    {
      "elmType": "div",
      "style": {
        "position": "absolute",
        "top": "8px",
        "height": "4px",
        "border-radius": "2px",
        "background-color": "#cbd5e1",
        "left": "=if(if(Number([$Start]) < 0, 0, if(Number([$Start]) > 100, 100, Number([$Start]))) < if(Number(@currentField) < 0, 0, if(Number(@currentField) > 100, 100, Number(@currentField))), if(Number([$Start]) < 0, 0, if(Number([$Start]) > 100, 100, Number([$Start]))), if(Number(@currentField) < 0, 0, if(Number(@currentField) > 100, 100, Number(@currentField)))) + '%'",
        "width": "=abs(if(Number(@currentField) < 0, 0, if(Number(@currentField) > 100, 100, Number(@currentField))) - if(Number([$Start]) < 0, 0, if(Number([$Start]) > 100, 100, Number([$Start])))) + '%'"
      }
    },
    {
      "elmType": "div",
      "style": {
        "position": "absolute",
        "top": "3px",
        "width": "12px",
        "height": "12px",
        "border-radius": "50%",
        "background-color": "#94a3b8",
        "border": "2px solid #ffffff",
        "margin-left": "-6px",
        "left": "=if(Number([$Start]) < 0, 0, if(Number([$Start]) > 100, 100, Number([$Start]))) + '%'"
      }
    },
    {
      "elmType": "div",
      "style": {
        "position": "absolute",
        "top": "3px",
        "width": "12px",
        "height": "12px",
        "border-radius": "50%",
        "background-color": "#0f6cbd",
        "border": "2px solid #ffffff",
        "margin-left": "-6px",
        "left": "=if(Number(@currentField) < 0, 0, if(Number(@currentField) > 100, 100, Number(@currentField))) + '%'"
      }
    }
  ]
}
Battery Gauge
Shows a level as a familiar battery that fills up and shifts color as it drains, so anyone can read how much is left without thinking about the number. The fill grows with the value and turns green when healthy, amber when getting low, and red when nearly empty, with the percent shown beside it.
Required Columns
| Display name | Column type | Internal name |
|---|---|---|
| Vehicle | Single line of text | [Title] |
| Fuel | Number | [Fuel] |
Prerequisites
- Build a list with these columns before you paste the JSON.
- Then populate the list with values from 0 to 100.
- Because the JSON is applied at the column level, the Fuel column can use any name you want.
- The green, amber, and red thresholds live in the JSON – change them to match your own bands.
- Store the value in a Number column on a 0 to 100 scale – a value stored as a decimal such as 0.73 will not display as 73 percent.
JSON Instructions
- On the Fuel column, open the column header menu, choose Column settings, then Format this column.
- Switch to Advanced mode.
- Paste the JSON below and click Save.
{
  "$schema": "https://developer.microsoft.com/json-schemas/sp/v2/column-formatting.schema.json",
  "elmType": "div",
  "style": {
    "display": "inline-flex",
    "align-items": "center",
    "gap": "7px"
  },
  "children": [
    {
      "elmType": "div",
      "style": {
        "width": "46px",
        "height": "22px",
        "border": "2px solid #605e5c",
        "border-radius": "4px",
        "padding": "2px",
        "box-sizing": "border-box",
        "position": "relative"
      },
      "children": [
        {
          "elmType": "div",
          "style": {
            "height": "100%",
            "border-radius": "2px",
            "width": "=if(Number(@currentField) < 0, 0, if(Number(@currentField) > 100, 100, Number(@currentField))) + '%'",
            "background-color": "=if(@currentField == '', '#c8c6c4', if(Number(@currentField) >= 50, '#22a06b', if(Number(@currentField) >= 20, '#f59e0b', '#e0523f')))"
          }
        }
      ]
    },
    {
      "elmType": "div",
      "style": {
        "width": "3px",
        "height": "9px",
        "border-radius": "0 2px 2px 0",
        "background-color": "#605e5c"
      }
    },
    {
      "elmType": "span",
      "txtContent": "=if(@currentField == '', '-', @currentField + '%')",
      "style": {
        "font-size": "12px",
        "font-weight": "600",
        "color": "#201f1e"
      }
    }
  ]
}Stacked Progress Bar
Packs a whole breakdown into a single bar, so one glance shows how a project’s work splits across Done, In Progress, and To Do. The bar reads three count columns and renders each as a proportional colored segment – green for done, blue for in progress, gray for still to do – with a running X of Y done label beside it, turning three numbers into one clear picture.
Required Columns
| Display name | Column type | Internal name |
|---|---|---|
| Title | Single line of text | [Title] |
| Done | Number | [Done] |
| In Progress | Number | [InProgress] |
| To Do | Number | [ToDo] |
| Owner | Person or Group | [Owner] |
Prerequisites
- Build a list with these columns before you paste the JSON.
- Populate the list with data (the counts of items in each state).
- Internal column names (in brackets) must match the JSON exactly.
JSON Instructions
- On the Done column, open the column header menu, choose Column settings, then Format this column.
- Switch to Advanced mode.
- Paste the JSON below and click Save.
{
  "$schema": "https://developer.microsoft.com/json-schemas/sp/v2/column-formatting.schema.json",
  "elmType": "div",
  "style": {
    "display": "flex",
    "align-items": "center"
  },
  "children": [
    {
      "elmType": "div",
      "style": {
        "display": "flex",
        "flex-direction": "row",
        "width": "160px",
        "flex-shrink": "0",
        "height": "14px",
        "border-radius": "7px",
        "overflow": "hidden",
        "background-color": "#edebe9"
      },
      "children": [
        {
          "elmType": "div",
          "style": {
            "flex-grow": "=if([$Done] == '', 0, Number([$Done]))",
            "flex-shrink": "1",
            "flex-basis": "0",
            "background-color": "#107c10"
          }
        },
        {
          "elmType": "div",
          "style": {
            "flex-grow": "=if([$InProgress] == '', 0, Number([$InProgress]))",
            "flex-shrink": "1",
            "flex-basis": "0",
            "background-color": "#0078d4"
          }
        },
        {
          "elmType": "div",
          "style": {
            "flex-grow": "=if([$ToDo] == '', 0, Number([$ToDo]))",
            "flex-shrink": "1",
            "flex-basis": "0",
            "background-color": "#c8c6c4"
          }
        }
      ]
    },
    {
      "elmType": "span",
      "style": {
        "margin-left": "9px",
        "font-size": "12.5px",
        "font-weight": "500",
        "color": "#484644",
        "white-space": "nowrap"
      },
      "txtContent": "=if((if([$Done] == '', 0, Number([$Done])) + if([$InProgress] == '', 0, Number([$InProgress])) + if([$ToDo] == '', 0, Number([$ToDo]))) == 0, '0 of 0 done (0%)', if([$Done] == '', 0, Number([$Done])) + ' of ' + (if([$Done] == '', 0, Number([$Done])) + if([$InProgress] == '', 0, Number([$InProgress])) + if([$ToDo] == '', 0, Number([$ToDo]))) + ' done (' + floor((if([$Done] == '', 0, Number([$Done])) / (if([$Done] == '', 0, Number([$Done])) + if([$InProgress] == '', 0, Number([$InProgress])) + if([$ToDo] == '', 0, Number([$ToDo])))) * 100) + '%)')"
    }
  ]
}Percent Progress Bar
Turns a plain number column into an at-a-glance horizontal bar, so anyone scanning a SharePoint list can see how far along each item is without reading the figure. The bar fills to match the percentage, shifts color as work advances (amber, then blue, then green at 100%), and falls back cleanly when a value is blank.
Required Columns
| Display name | Column type | Internal name |
|---|---|---|
| Title | Single line of text | [Title] |
| % Complete | Number | [% Complete] |
| Status | Choice | [Status] |
| Assigned To | Person or Group | [Assigned To] |
| Due Date | Date and time | [Due Date] |
Prerequisites
- Build a list with these columns before you paste the JSON.
- Populate the list with data.
- Because the JSON is applied at the column level, the % Complete column can use any name you want.
- It only needs to store a value from 0 to 100.
JSON Instructions
- On the % Complete column, open the column header menu, choose Column settings, then Format this column.
- Switch to Advanced mode.
- Paste the JSON below and click Save.
{
  "$schema": "https://developer.microsoft.com/json-schemas/sp/v2/column-formatting.schema.json",
  "elmType": "div",
  "style": {
    "display": "flex",
    "flex-direction": "row",
    "align-items": "center",
    "width": "100%"
  },
  "children": [
    {
      "elmType": "div",
      "style": {
        "flex-grow": "1",
        "height": "14px",
        "border-radius": "7px",
        "background-color": "#edebe9",
        "overflow": "hidden",
        "box-sizing": "border-box"
      },
      "children": [
        {
          "elmType": "div",
          "style": {
            "height": "14px",
            "border-radius": "7px",
            "width": "=if(@currentField == '', '0', if(Number(@currentField) > 100, '100', if(Number(@currentField) < 0, '0', Number(@currentField)))) + '%'",
            "background-color": "=if(@currentField == '', '#edebe9', if(Number(@currentField) >= 100, '#107c10', if(Number(@currentField) >= 50, '#0078d4', '#ffaa44')))"
          }
        }
      ]
    },
    {
      "elmType": "span",
      "style": {
        "margin-left": "8px",
        "min-width": "36px",
        "text-align": "right",
        "font-size": "12px",
        "color": "#605e5c"
      },
      "txtContent": "=if(@currentField == '', '0', if(Number(@currentField) > 100, '100', if(Number(@currentField) < 0, '0', Number(@currentField)))) + '%'"
    }
  ]
}Thermometer Bar
Shows progress toward a goal as a vertical fill that rises like a thermometer, so a goal reads at a glance as how full the tube is. The tube fills from a bulb at the bottom upward to match the value, shifts color as it climbs (amber, then blue, then green at the 100% goal), and shows the percentage beside it – and because it reads the current column, you can drop it on any percent field across your sites.
Required Columns
| Display name | Column type | Internal name |
|---|---|---|
| Title | Single line of text | [Title] |
| % to Goal | Number | [% to Goal] |
| Owner | Person or Group | [Owner] |
| Target | Single line of text | [Target] |
Prerequisites
- Build a list with these columns before you paste the JSON.
- Populate the list with data.
- Because the JSON is applied at the column level, the % to Goal column can use any name you want.
- It expects a Number from 0 to 100; values outside that range are clamped and a blank cell shows an empty tube. Change the color thresholds in the JSON to match your own scale.
JSON Instructions
- On the % to Goal column, open the column header menu, choose Column settings, then Format this column.
- Switch to Advanced mode.
- Paste the JSON below and click Save.
{
  "$schema": "https://developer.microsoft.com/json-schemas/sp/v2/column-formatting.schema.json",
  "elmType": "div",
  "style": { "display": "inline-flex", "align-items": "center" },
  "children": [
    {
      "elmType": "div",
      "style": { "position": "relative", "width": "20px", "height": "50px" },
      "children": [
        {
          "elmType": "div",
          "style": {
            "position": "absolute", "left": "5px", "top": "0px",
            "width": "10px", "height": "38px",
            "border-radius": "5px", "overflow": "hidden",
            "background-color": "#edebe9"
          },
          "children": [
            {
              "elmType": "div",
              "style": {
                "position": "absolute", "left": "0px", "bottom": "0px", "width": "100%",
                "height": "=(if(@currentField == '', 0, if(Number(@currentField) > 100, 100, if(Number(@currentField) < 0, 0, Number(@currentField))))) + '%'",
                "background-color": "=if(@currentField == '', '#c8c6c4', if(Number(@currentField) >= 100, '#107c10', if(Number(@currentField) >= 50, '#0078d4', '#ffaa44')))"
              }
            }
          ]
        },
        {
          "elmType": "div",
          "style": {
            "position": "absolute", "bottom": "0px", "left": "2px",
            "width": "16px", "height": "16px", "border-radius": "50%",
            "background-color": "=if(@currentField == '', '#c8c6c4', if(Number(@currentField) >= 100, '#107c10', if(Number(@currentField) >= 50, '#0078d4', '#ffaa44')))"
          }
        }
      ]
    },
    {
      "elmType": "span",
      "style": {
        "margin-left": "8px", "font-size": "12px", "font-weight": "600",
        "color": "=if(@currentField == '', '#a19f9d', if(Number(@currentField) >= 100, '#107c10', if(Number(@currentField) >= 50, '#0078d4', '#9a6212')))"
      },
      "txtContent": "=(if(@currentField == '', 0, if(Number(@currentField) > 100, 100, if(Number(@currentField) < 0, 0, Number(@currentField))))) + '%'"
    }
  ]
}Star Rating
Turns a plain number into a familiar row of five stars, so a score reads instantly as how many stars are filled. The stars fill gold up to the rating, the rest stay outlined, and the score shows beside them – and because it reads the current column, you can drop it on any 0 to 5 rating field across your sites.
Required Columns
| Display name | Column type | Internal name |
|---|---|---|
| Title | Single line of text | [Title] |
| Rating | Number | [Rating] |
| Reviewer | Person or Group | [Reviewer] |
| Category | Choice | [Category] |
Prerequisites
- Build a list with these columns before you paste the JSON.
- Populate the list with data.
- Because the JSON is applied at the column level, the Rating column can use any name you want.
- It expects a whole Number from 0 to 5; a blank cell shows five empty stars. Add or remove a star, or change the gold color, right in the JSON.
JSON Instructions
- On the Rating column, open the column header menu, choose Column settings, then Format this column.
- Switch to Advanced mode.
- Paste the JSON below and click Save.
{
  "$schema": "https://developer.microsoft.com/json-schemas/sp/v2/column-formatting.schema.json",
  "elmType": "div",
  "style": {
    "display": "inline-flex",
    "align-items": "center"
  },
  "children": [
    {
      "elmType": "span",
      "attributes": {
        "iconName": "=if((if(@currentField == '', 0, Number(@currentField))) >= 1, 'FavoriteStarFill', 'FavoriteStar')"
      },
      "style": {
        "font-size": "16px",
        "margin-right": "1px",
        "color": "=if((if(@currentField == '', 0, Number(@currentField))) >= 1, '#ff9f00', '#c8c6c4')"
      }
    },
    {
      "elmType": "span",
      "attributes": {
        "iconName": "=if((if(@currentField == '', 0, Number(@currentField))) >= 2, 'FavoriteStarFill', 'FavoriteStar')"
      },
      "style": {
        "font-size": "16px",
        "margin-right": "1px",
        "color": "=if((if(@currentField == '', 0, Number(@currentField))) >= 2, '#ff9f00', '#c8c6c4')"
      }
    },
    {
      "elmType": "span",
      "attributes": {
        "iconName": "=if((if(@currentField == '', 0, Number(@currentField))) >= 3, 'FavoriteStarFill', 'FavoriteStar')"
      },
      "style": {
        "font-size": "16px",
        "margin-right": "1px",
        "color": "=if((if(@currentField == '', 0, Number(@currentField))) >= 3, '#ff9f00', '#c8c6c4')"
      }
    },
    {
      "elmType": "span",
      "attributes": {
        "iconName": "=if((if(@currentField == '', 0, Number(@currentField))) >= 4, 'FavoriteStarFill', 'FavoriteStar')"
      },
      "style": {
        "font-size": "16px",
        "margin-right": "1px",
        "color": "=if((if(@currentField == '', 0, Number(@currentField))) >= 4, '#ff9f00', '#c8c6c4')"
      }
    },
    {
      "elmType": "span",
      "attributes": {
        "iconName": "=if((if(@currentField == '', 0, Number(@currentField))) >= 5, 'FavoriteStarFill', 'FavoriteStar')"
      },
      "style": {
        "font-size": "16px",
        "margin-right": "1px",
        "color": "=if((if(@currentField == '', 0, Number(@currentField))) >= 5, '#ff9f00', '#c8c6c4')"
      }
    },
    {
      "elmType": "span",
      "style": {
        "margin-left": "7px",
        "font-size": "12px",
        "color": "#605e5c"
      },
      "txtContent": "=if(@currentField == '', '', Number(@currentField) + ' / 5')"
    }
  ]
}Smart Date Label
Turns a plain SharePoint date column into a friendly, color-coded pill, so a due date reads as Today, Tomorrow, or Friday at a glance instead of a bare 6/5/2026. It says Yesterday, Today, and Tomorrow for the days around now, names the weekday for anything within the coming week, and shows a tidy month-and-day for everything else – each in a color that signals how close it is.
Required Columns
| Display name | Column type | Internal name |
|---|---|---|
| Due Date | Date and Time | [DueDate] |
Prerequisites
- Add a Date column to your list before you paste the JSON.
- Then populate it with your dates.
- The JSON reads a column named DueDate – either name your date column DueDate or change [$DueDate] in the JSON to match your column’s internal name.
- Use a real Date column, not a text column that only looks like a date.
- Test several values – yesterday, today, tomorrow, a date later this week, a further-out date, and a blank field.
- If a label reads one day early or late, check whether the column is set to Date only or Date and time and confirm the site’s regional time zone before changing the JSON.
JSON Instructions
- Select the Due Date column header, then Column settings, then Format this column.
- Switch to Advanced mode.
- Paste the JSON below and click Save.
{
  "$schema": "https://developer.microsoft.com/json-schemas/sp/v2/column-formatting.schema.json",
  "elmType": "div",
  "style": {
    "display": "flex",
    "align-items": "center",
    "justify-content": "center",
    "height": "100%",
    "width": "100%",
    "box-sizing": "border-box"
  },
  "children": [
    {
      "elmType": "div",
      "style": {
        "position": "relative",
        "display": "flex",
        "align-items": "center",
        "width": "108px",
        "height": "26px",
        "box-sizing": "border-box",
        "border-radius": "13px",
        "font-size": "14px",
        "font-weight": "700",
        "line-height": "20px",
        "white-space": "nowrap",
        "color": "=if(@currentField == '', '#737373', if((floor(Number(Date(@currentField)) / 86400000) - floor(Number(Date(@now)) / 86400000)) == 0, '#0067b8', if((floor(Number(Date(@currentField)) / 86400000) - floor(Number(Date(@now)) / 86400000)) == 1, '#805b00', if((floor(Number(Date(@currentField)) / 86400000) - floor(Number(Date(@now)) / 86400000)) == -1, '#4f4f4f', if(((floor(Number(Date(@currentField)) / 86400000) - floor(Number(Date(@now)) / 86400000)) > 1) && ((floor(Number(Date(@currentField)) / 86400000) - floor(Number(Date(@now)) / 86400000)) <= 7), '#087508', if((floor(Number(Date(@currentField)) / 86400000) - floor(Number(Date(@now)) / 86400000)) < 0, '#4f4f4f', '#172033'))))))",
        "background-color": "=if(@currentField == '', '#e5e5e5', if((floor(Number(Date(@currentField)) / 86400000) - floor(Number(Date(@now)) / 86400000)) == 0, '#cfe8ff', if((floor(Number(Date(@currentField)) / 86400000) - floor(Number(Date(@now)) / 86400000)) == 1, '#ffe49a', if((floor(Number(Date(@currentField)) / 86400000) - floor(Number(Date(@now)) / 86400000)) == -1, '#dedede', if(((floor(Number(Date(@currentField)) / 86400000) - floor(Number(Date(@now)) / 86400000)) > 1) && ((floor(Number(Date(@currentField)) / 86400000) - floor(Number(Date(@now)) / 86400000)) <= 7), '#cef0d7', if((floor(Number(Date(@currentField)) / 86400000) - floor(Number(Date(@now)) / 86400000)) < 0, '#dedede', '#dce6f2'))))))"
      },
      "children": [
        {
          "elmType": "div",
          "style": {
            "position": "absolute",
            "left": "8px",
            "top": "4px",
            "width": "17px",
            "height": "17px",
            "overflow": "hidden",
            "box-sizing": "border-box",
            "background-color": "#ffffff",
            "border": "1px solid #d1d1d1",
            "border-radius": "3px"
          },
          "children": [
            {
              "elmType": "div",
              "style": {
                "position": "absolute",
                "left": "0",
                "right": "0",
                "top": "0",
                "height": "6px",
                "background-color": "#e53935"
              }
            },
            {
              "elmType": "div",
              "style": {
                "position": "absolute",
                "left": "3px",
                "top": "1px",
                "width": "2px",
                "height": "3px",
                "background-color": "#ffffff",
                "border-radius": "1px"
              }
            },
            {
              "elmType": "div",
              "style": {
                "position": "absolute",
                "right": "3px",
                "top": "1px",
                "width": "2px",
                "height": "3px",
                "background-color": "#ffffff",
                "border-radius": "1px"
              }
            },
            {
              "elmType": "span",
              "style": {
                "position": "absolute",
                "left": "0",
                "right": "0",
                "top": "5px",
                "height": "11px",
                "display": "flex",
                "align-items": "center",
                "justify-content": "center",
                "font-size": "8px",
                "font-weight": "800",
                "line-height": "11px",
                "color": "#242424"
              },
              "txtContent": "17"
            }
          ]
        },
        {
          "elmType": "span",
          "style": {
            "position": "absolute",
            "left": "30px",
            "right": "6px",
            "top": "3px",
            "height": "20px",
            "line-height": "20px",
            "text-align": "center"
          },
          "txtContent": "=if(@currentField == '', 'No date', if((floor(Number(Date(@currentField)) / 86400000) - floor(Number(Date(@now)) / 86400000)) == 0, 'Today', if((floor(Number(Date(@currentField)) / 86400000) - floor(Number(Date(@now)) / 86400000)) == 1, 'Tomorrow', if((floor(Number(Date(@currentField)) / 86400000) - floor(Number(Date(@now)) / 86400000)) == -1, 'Yesterday', if(((floor(Number(Date(@currentField)) / 86400000) - floor(Number(Date(@now)) / 86400000)) > 1) && ((floor(Number(Date(@currentField)) / 86400000) - floor(Number(Date(@now)) / 86400000)) <= 7), if(((floor(Number(Date(@currentField)) / 86400000) + 4) % 7) == 0, 'Sunday', if(((floor(Number(Date(@currentField)) / 86400000) + 4) % 7) == 1, 'Monday', if(((floor(Number(Date(@currentField)) / 86400000) + 4) % 7) == 2, 'Tuesday', if(((floor(Number(Date(@currentField)) / 86400000) + 4) % 7) == 3, 'Wednesday', if(((floor(Number(Date(@currentField)) / 86400000) + 4) % 7) == 4, 'Thursday', if(((floor(Number(Date(@currentField)) / 86400000) + 4) % 7) == 5, 'Friday', 'Saturday')))))), (if(getMonth(Date(@currentField)) == 0, 'Jan', if(getMonth(Date(@currentField)) == 1, 'Feb', if(getMonth(Date(@currentField)) == 2, 'Mar', if(getMonth(Date(@currentField)) == 3, 'Apr', if(getMonth(Date(@currentField)) == 4, 'May', if(getMonth(Date(@currentField)) == 5, 'Jun', if(getMonth(Date(@currentField)) == 6, 'Jul', if(getMonth(Date(@currentField)) == 7, 'Aug', if(getMonth(Date(@currentField)) == 8, 'Sep', if(getMonth(Date(@currentField)) == 9, 'Oct', if(getMonth(Date(@currentField)) == 10, 'Nov', 'Dec'))))))))))) + ' ' + getDate(Date(@currentField))))))))"
        }
      ]
    }
  ]
}Timeline Dot
Places a small dot along a little past-to-future axis, so you can eyeball where each item’s date falls relative to today without reading the date at all. The dot sits left of center for past dates and right for upcoming ones, colored by which side of now it lands on.
Required Columns
| Display name | Column type | Internal name |
|---|---|---|
| Task | Single line of text | [Title] |
| Due | Date and time | [Due] |
Prerequisites
- Build a list with these columns before you paste the JSON.
- Then populate the list with dates.
- Because the JSON is applied at the column level, the Due column can use any name you want.
- The window (30 days each side of today) lives in the JSON – widen or narrow it to fit your horizon.
- Dates beyond the 30-day window are pulled to the left or right edge, and because it reads a date the result depends on your tenant time zone and the time of day – test close to midnight.
JSON Instructions
- On the Due column, open the column header menu, choose Column settings, then Format this column.
- Switch to Advanced mode.
- Paste the JSON below and click Save.
{
  "$schema": "https://developer.microsoft.com/json-schemas/sp/v2/column-formatting.schema.json",
  "elmType": "div",
  "style": {
    "position": "relative",
    "width": "150px",
    "height": "20px"
  },
  "children": [
    {
      "elmType": "div",
      "style": {
        "position": "absolute",
        "left": "0",
        "right": "0",
        "top": "9px",
        "height": "2px",
        "background-color": "#c8c6c4"
      }
    },
    {
      "elmType": "div",
      "style": {
        "position": "absolute",
        "left": "50%",
        "top": "4px",
        "width": "1px",
        "height": "12px",
        "background-color": "#a19f9d"
      }
    },
    {
      "elmType": "div",
      "style": {
        "display": "=if(@currentField == '', 'none', 'block')",
        "position": "absolute",
        "top": "3px",
        "width": "12px",
        "height": "12px",
        "border-radius": "50%",
        "border": "2px solid #ffffff",
        "margin-left": "-6px",
        "left": "=(if((((Number(Date(@currentField)) - Number(@now)) / 86400000) + 30) / 60 * 100 < 0, 0, if((((Number(Date(@currentField)) - Number(@now)) / 86400000) + 30) / 60 * 100 > 100, 100, (((Number(Date(@currentField)) - Number(@now)) / 86400000) + 30) / 60 * 100))) + '%'",
        "background-color": "=if(((Number(Date(@currentField)) - Number(@now)) / 86400000) < -1, '#8996ab', if(((Number(Date(@currentField)) - Number(@now)) / 86400000) > 1, '#0b5cad', '#0f7a3d'))"
      }
    }
  ]
}Time-Ago Pill
Shows a date as a friendly, colored phrase – today, a few days ago, or in a few days – so a reader instantly grasps how fresh or how soon something is without doing the date math. The JSON compares the date to now and colors the pill by whether it is recent, in the past, or still ahead.
Required Columns
| Display name | Column type | Internal name |
|---|---|---|
| Document | Single line of text | [Title] |
| Updated | Date and time | [Updated] |
Prerequisites
- Build a list with these columns before you paste the JSON.
- Then populate the list with dates.
- Because the JSON is applied at the column level, the Updated column can use any name you want.
- The phrasing and colors are computed against the current day – no extra setup is needed.
- Because the label is computed against today’s date, it depends on your tenant time zone and the time of day – test close to midnight.
JSON Instructions
- On the Updated column, open the column header menu, choose Column settings, then Format this column.
- Switch to Advanced mode.
- Paste the JSON below and click Save.
{
  "$schema": "https://developer.microsoft.com/json-schemas/sp/v2/column-formatting.schema.json",
  "elmType": "div",
  "style": {
    "display": "flex",
    "align-items": "center",
    "justify-content": "flex-start",
    "height": "100%"
  },
  "children": [
    {
      "elmType": "span",
      "txtContent": "=if(@currentField == '', '-', if(abs(((Number(Date(@currentField)) - Number(@now)) / 86400000)) < 1, 'today', if(((Number(Date(@currentField)) - Number(@now)) / 86400000) < 0, if(indexOf(((abs(((Number(Date(@currentField)) - Number(@now)) / 86400000))) + ''), '.') < 0, ((abs(((Number(Date(@currentField)) - Number(@now)) / 86400000))) + ''), substring(((abs(((Number(Date(@currentField)) - Number(@now)) / 86400000))) + ''), 0, indexOf(((abs(((Number(Date(@currentField)) - Number(@now)) / 86400000))) + ''), '.'))) + ' d ago', 'in ' + if(indexOf(((abs(((Number(Date(@currentField)) - Number(@now)) / 86400000))) + ''), '.') < 0, ((abs(((Number(Date(@currentField)) - Number(@now)) / 86400000))) + ''), substring(((abs(((Number(Date(@currentField)) - Number(@now)) / 86400000))) + ''), 0, indexOf(((abs(((Number(Date(@currentField)) - Number(@now)) / 86400000))) + ''), '.'))) + ' d')))",
      "style": {
        "display": "inline-block",
        "padding": "6px 14px",
        "border-radius": "14px",
        "font-size": "13px",
        "font-weight": "700",
        "line-height": "17px",
        "text-align": "center",
        "white-space": "nowrap",
        "color": "=if(@currentField == '', '#475569', if(abs(((Number(Date(@currentField)) - Number(@now)) / 86400000)) < 1, '#0c9e52', if(((Number(Date(@currentField)) - Number(@now)) / 86400000) < 0, '#bf5b00', '#1d4ed8')))",
        "background-color": "=if(@currentField == '', '#e6eaf0', if(abs(((Number(Date(@currentField)) - Number(@now)) / 86400000)) < 1, '#ccf5de', if(((Number(Date(@currentField)) - Number(@now)) / 86400000) < 0, '#ffe9cf', '#d6e4ff')))"
      }
    }
  ]
}Gantt Bar
Draws a colored bar spanning from a start date to an end date across the cell, so a list of phases or tasks reads like a mini schedule right in the view. Both dates are placed on a shared rolling window so the bars line up row to row.
Required Columns
| Display name | Column type | Internal name |
|---|---|---|
| Phase | Single line of text | [Title] |
| Start | Date and time | [Start] |
| End | Date and time | [End] |
Prerequisites
- Build a list with these columns before you paste the JSON.
- Then populate each row with a start date and an end date.
- The JSON reads the start date from the Start column, so its internal name in brackets must match the JSON exactly – or rename [$Start] in the JSON to your own column.
- Apply the formatting to the end-date column, not to the Start column.
- The chart shows a fixed window of about 15 days before today through 75 days after today – dates outside that range are pulled to the nearest edge.
JSON Instructions
- On the End column, open the column header menu, choose Column settings, then Format this column.
- Switch to Advanced mode.
- Paste the JSON below and click Save.
{
  "$schema": "https://developer.microsoft.com/json-schemas/sp/v2/column-formatting.schema.json",
  "elmType": "div",
  "style": {
    "display": "flex",
    "align-items": "center",
    "width": "100%",
    "height": "100%",
    "box-sizing": "border-box"
  },
  "children": [
    {
      "elmType": "div",
      "style": {
        "position": "relative",
        "width": "100%",
        "height": "14px",
        "min-height": "14px",
        "max-height": "14px",
        "background-color": "#eeecea",
        "border-radius": "7px",
        "overflow": "hidden",
        "box-sizing": "border-box"
      },
      "children": [
        {
          "elmType": "div",
          "style": {
            "display": "=if(if(@currentField == '', false, if([$Start] == '', false, true)), 'block', 'none')",
            "position": "absolute",
            "top": "0",
            "height": "100%",
            "border-radius": "7px",
            "background-color": "#0f6cbd",
            "left": "=(if((((Number(Date([$Start])) - Number(@now)) / 86400000) + 15) / 90 * 100 < 0, 0, if((((Number(Date([$Start])) - Number(@now)) / 86400000) + 15) / 90 * 100 > 100, 100, (((Number(Date([$Start])) - Number(@now)) / 86400000) + 15) / 90 * 100))) + '%'",
            "width": "=((if((((Number(Date(@currentField)) - Number(@now)) / 86400000) + 15) / 90 * 100 < 0, 0, if((((Number(Date(@currentField)) - Number(@now)) / 86400000) + 15) / 90 * 100 > 100, 100, (((Number(Date(@currentField)) - Number(@now)) / 86400000) + 15) / 90 * 100))) - (if((((Number(Date([$Start])) - Number(@now)) / 86400000) + 15) / 90 * 100 < 0, 0, if((((Number(Date([$Start])) - Number(@now)) / 86400000) + 15) / 90 * 100 > 100, 100, (((Number(Date([$Start])) - Number(@now)) / 86400000) + 15) / 90 * 100)))) + '%'"
          }
        }
      ]
    }
  ]
}Countdown Badge
Shows how many days are left until a date as a round, colored token that turns from green to amber to red as the deadline approaches and overdue. The JSON counts the days to the date and colors the coin by urgency, so what needs attention pops out of the list.
Required Columns
| Display name | Column type | Internal name |
|---|---|---|
| Item | Single line of text | [Title] |
| Due | Date and time | [Due] |
Prerequisites
- Build a list with these columns before you paste the JSON.
- Then populate the list with dates.
- Because the JSON is applied at the column level, the Due column can use any name you want.
- The near and overdue thresholds live in the JSON – change them to match how your team reads urgency.
- It shows four separate states – overdue, 0 to 7 days, 8 to 30 days, and more than 30 days – and because it reads a date the result depends on your tenant time zone and time of day (test close to midnight).
JSON Instructions
- On the Due column, open the column header menu, choose Column settings, then Format this column.
- Switch to Advanced mode.
- Paste the JSON below and click Save.
{
  "$schema": "https://developer.microsoft.com/json-schemas/sp/v2/column-formatting.schema.json",
  "elmType": "div",
  "style": {
    "width": "100%",
    "display": "flex",
    "justify-content": "center",
    "align-items": "center",
    "padding-top": "4px",
    "padding-bottom": "4px",
    "box-sizing": "border-box"
  },
  "children": [
    {
      "elmType": "div",
      "style": {
        "width": "40px",
        "min-width": "40px",
        "max-width": "40px",
        "height": "40px",
        "min-height": "40px",
        "max-height": "40px",
        "border-radius": "50%",
        "display": "flex",
        "align-items": "center",
        "justify-content": "center",
        "text-align": "center",
        "box-sizing": "border-box",
        "font-size": "13px",
        "font-weight": "800",
        "color": "#ffffff",
        "background-color": "=if(@currentField == '', '#b8b8b8', if(((Number(Date(@currentField)) - Number(@now)) / 86400000) < 0, '#d92d20', if(((Number(Date(@currentField)) - Number(@now)) / 86400000) <= 7, '#f79009', if(((Number(Date(@currentField)) - Number(@now)) / 86400000) <= 30, '#12a866', '#067647'))))"
      },
      "txtContent": "=if(@currentField == '', '-', if(((Number(Date(@currentField)) - Number(@now)) / 86400000) < 0, if(indexOf(((abs(((Number(Date(@currentField)) - Number(@now)) / 86400000))) + ''), '.') < 0, ((abs(((Number(Date(@currentField)) - Number(@now)) / 86400000))) + ''), substring(((abs(((Number(Date(@currentField)) - Number(@now)) / 86400000))) + ''), 0, indexOf(((abs(((Number(Date(@currentField)) - Number(@now)) / 86400000))) + ''), '.'))) + 'd', if(indexOf(((abs(((Number(Date(@currentField)) - Number(@now)) / 86400000))) + ''), '.') < 0, ((abs(((Number(Date(@currentField)) - Number(@now)) / 86400000))) + ''), substring(((abs(((Number(Date(@currentField)) - Number(@now)) / 86400000))) + ''), 0, indexOf(((abs(((Number(Date(@currentField)) - Number(@now)) / 86400000))) + ''), '.'))) + 'd'))"
    }
  ]
}Calendar Tile
Turns a plain date into a little calendar page – a colored month band above a big day number – so a date column reads at a glance like a row of desk-calendar tiles. The JSON pulls the month and day out of the date and stacks them into a compact tile, and a blank date falls back to a neutral placeholder.
Required Columns
| Display name | Column type | Internal name |
|---|---|---|
| Event | Single line of text | [Title] |
| Date | Date and time | [Date] |
Prerequisites
- Build a list with these columns before you paste the JSON.
- Then populate the list with dates.
- Because the JSON is applied at the column level, the Date column can use any name you want.
- The month band color lives in the JSON – change it to match your brand.
- The month labels are English abbreviations set in the JSON – edit them there if you need another language.
- Because the tile reads a date, the result depends on your tenant time zone and the time of day – test close to midnight.
JSON Instructions
- On the Date column, open the column header menu, choose Column settings, then Format this column.
- Switch to Advanced mode.
- Paste the JSON below and click Save.
{
  "$schema": "https://developer.microsoft.com/json-schemas/sp/v2/column-formatting.schema.json",
  "elmType": "div",
  "style": {
    "width": "82px",
    "height": "38px",
    "border-radius": "6px",
    "overflow": "hidden",
    "border": "1px solid #d9d9d9",
    "box-shadow": "0 1px 2px rgba(0,0,0,0.10)",
    "display": "flex",
    "flex-direction": "row",
    "align-items": "stretch",
    "box-sizing": "border-box",
    "background-color": "=if(@currentField == '', '#f3f2f1', '#ffffff')"
  },
  "children": [
    {
      "elmType": "div",
      "txtContent": "=if(@currentField == '', '', substring('JANFEBMARAPRMAYJUNJULAUGSEPOCTNOVDEC', getMonth(@currentField) * 3, getMonth(@currentField) * 3 + 3))",
      "style": {
        "display": "=if(@currentField == '', 'none', 'flex')",
        "width": "36px",
        "align-items": "center",
        "justify-content": "center",
        "background-color": "#D12F55",
        "color": "#ffffff",
        "font-size": "11px",
        "font-weight": "700",
        "letter-spacing": "0.5px"
      }
    },
    {
      "elmType": "div",
      "txtContent": "=if(@currentField == '', '--', getDate(@currentField) + '')",
      "style": {
        "width": "=if(@currentField == '', '100%', '46px')",
        "display": "flex",
        "align-items": "center",
        "justify-content": "center",
        "background-color": "=if(@currentField == '', '#f3f2f1', '#ffffff')",
        "color": "=if(@currentField == '', '#8a8886', '#201f1e')",
        "font-size": "=if(@currentField == '', '17px', '22px')",
        "font-weight": "700",
        "line-height": "1"
      }
    }
  ]
}Age Heat Indicator
Warms a date cell from cool to hot as the item gets older, so stale rows surface themselves in a list without anyone sorting or filtering. The JSON measures how many days have passed and tints the cell accordingly, showing the age in days right in the column.
Required Columns
| Display name | Column type | Internal name |
|---|---|---|
| Ticket | Single line of text | [Title] |
| Opened | Date and time | [Opened] |
Prerequisites
- Build a list with these columns before you paste the JSON.
- Then populate the list with dates.
- Because the JSON is applied at the column level, the Opened column can use any name you want.
- The age thresholds (7, 21, 45, and 55 days) live in the JSON – change them to match your own bands.
- Because the color bands are calculated from today’s date, the result depends on your tenant time zone and the time of day – test date rows close to midnight.
JSON Instructions
- On the Opened column, open the column header menu, choose Column settings, then Format this column.
- Switch to Advanced mode.
- Paste the JSON below and click Save.
{
  "$schema": "https://developer.microsoft.com/json-schemas/sp/v2/column-formatting.schema.json",
  "elmType": "div",
  "txtContent": "=if(@currentField == '', '-', if(Number(Date(@currentField)) == 0, '-', if(indexOf(((abs(((Number(@now) - Number(Date(@currentField))) / 86400000))) + ''), '.') < 0, ((abs(((Number(@now) - Number(Date(@currentField))) / 86400000))) + ''), substring(((abs(((Number(@now) - Number(Date(@currentField))) / 86400000))) + ''), 0, indexOf(((abs(((Number(@now) - Number(Date(@currentField))) / 86400000))) + ''), '.'))) + ' days'))",
  "style": {
    "display": "inline-block",
    "min-width": "70px",
    "padding": "4px 10px",
    "border-radius": "6px",
    "font-size": "13px",
    "font-weight": "600",
    "color": "#3d2b17",
    "background-color": "=if(@currentField == '', '#f3f2f1', if(Number(Date(@currentField)) == 0, '#f3f2f1', if(((Number(@now) - Number(Date(@currentField))) / 86400000) <= 7, '#eef6f0', if(((Number(@now) - Number(Date(@currentField))) / 86400000) <= 21, '#fff7ed', if(((Number(@now) - Number(Date(@currentField))) / 86400000) <= 45, '#ffe4c7', if(((Number(@now) - Number(Date(@currentField))) / 86400000) <= 55, '#fdd2d2', '#ffb3b3'))))))"
  }
}Numbered List Row
Gives each row of a SharePoint list a compact card led by a bold sequence number, so an ordered list – onboarding steps, a top ten, a ranked playbook – reads in order at a glance instead of as flat rows. Each card pairs a colored number badge with the item’s title and a short description, and anything left unranked falls back to a neutral badge so the view never looks broken.
Required Columns
| Display name | Column type | Internal name |
|---|---|---|
| Task | Single line of text | [Title] |
| Rank | Number | [Rank] |
| Description | Single line of text | [Description] |
Prerequisites
- Build a list with these columns before you paste the JSON.
- Then populate the list, giving each item a number in the Rank column.
- Internal column names (in brackets) must match the JSON exactly.
JSON Instructions
- Select the Task column header, then Column settings, then Format this column.
- Switch to Advanced mode.
- Paste the JSON below and click Save.
- Widen the Task column and hide the others so each card has room.
{
  "$schema": "https://developer.microsoft.com/json-schemas/sp/v2/column-formatting.schema.json",
  "elmType": "div",
  "style": {
    "display": "flex",
    "flex-direction": "row",
    "align-items": "center",
    "gap": "14px",
    "padding": "12px 16px",
    "margin": "6px 0",
    "background-color": "#ffffff",
    "border": "1px solid #e5e7eb",
    "border-left": "=if([$Rank] == '', '4px solid #9aa0a6', '4px solid #0f6cbd')",
    "border-radius": "10px",
    "box-shadow": "0 1px 2px rgba(0,0,0,0.08)",
    "box-sizing": "border-box"
  },
  "children": [
    {
      "elmType": "div",
      "style": {
        "flex-shrink": "0",
        "width": "42px",
        "height": "42px",
        "border-radius": "50%",
        "display": "flex",
        "align-items": "center",
        "justify-content": "center",
        "background-color": "=if([$Rank] == '', '#e1e3e6', '#0f6cbd')",
        "color": "=if([$Rank] == '', '#605e5c', '#ffffff')",
        "font-size": "18px",
        "font-weight": "700"
      },
      "txtContent": "=if([$Rank] == '', '-', [$Rank])"
    },
    {
      "elmType": "div",
      "style": {
        "display": "flex",
        "flex-direction": "column",
        "gap": "4px",
        "min-width": "0"
      },
      "children": [
        {
          "elmType": "div",
          "style": {
            "font-size": "15px",
            "font-weight": "600",
            "color": "#201f1e",
            "white-space": "nowrap",
            "overflow": "hidden",
            "text-overflow": "ellipsis"
          },
          "txtContent": "@currentField"
        },
        {
          "elmType": "div",
          "style": {
            "font-size": "13px",
            "color": "#4f4b47",
            "white-space": "nowrap",
            "overflow": "hidden",
            "text-overflow": "ellipsis"
          },
          "txtContent": "[$Description]"
        }
      ]
    }
  ]
}Content Navigation
Turns a simple SharePoint list into a set of clickable navigation tiles, so a landing page or hub can point people to the right place at a glance instead of listing bare links. Each tile shows a colored icon, a bold label, a short description, and a chevron, and the whole tile is one big link – anything with an unmapped icon falls back to a neutral link tile so the menu always looks intentional.
Required Columns
| Display name | Column type | Internal name |
|---|---|---|
| Label | Single line of text | [Title] |
| URL | Hyperlink | [Url] |
| Description | Single line of text | [Description] |
| Icon | Choice | [Icon] |
Prerequisites
- Build a list with these columns before you paste the JSON.
- Then add a row per destination – a label, the link, a short description, and an icon.
- Internal column names (in brackets) must match the JSON exactly.
- The icons key off the choice values Docs, Forms, People, Help, and Data – use these exact words or edit them in the JSON to match yours (anything else gets a neutral link icon).
- Create the destination field as a Hyperlink column, not an Image or Picture column.
- Use destination URLs the client users can open – the tile opens the link in a new tab but cannot bypass SharePoint, page, file, or form permissions.
JSON Instructions
- Select the Label column header, then Column settings, then Format this column.
- Switch to Advanced mode.
- Paste the JSON below and click Save.
- Widen the Label column and hide the others so each tile has room.
- Keep the view in List layout so the whole tile stays clickable.
{
  "$schema": "https://developer.microsoft.com/json-schemas/sp/v2/column-formatting.schema.json",
  "elmType": "a",
  "attributes": {
    "href": "[$Url]",
    "target": "_blank",
    "title": "=('Open ' + @currentField)"
  },
  "style": {
    "display": "flex",
    "flex-direction": "row",
    "align-items": "center",
    "gap": "14px",
    "padding": "12px 16px",
    "margin": "6px 0",
    "background-color": "#ffffff",
    "border": "1px solid #e5e7eb",
    "border-radius": "12px",
    "box-shadow": "0 1px 2px rgba(0,0,0,0.08)",
    "text-decoration": "none",
    "box-sizing": "border-box",
    "cursor": "pointer"
  },
  "children": [
    {
      "elmType": "div",
      "style": {
        "flex-shrink": "0",
        "width": "46px",
        "height": "46px",
        "border-radius": "10px",
        "display": "flex",
        "align-items": "center",
        "justify-content": "center",
        "font-size": "22px",
        "background-color": "=if([$Icon] == 'Docs', '#e5f0fa', if([$Icon] == 'Forms', '#e3f2f1', if([$Icon] == 'People', '#efe9f7', if([$Icon] == 'Help', '#fbe9df', if([$Icon] == 'Data', '#e7f5ec', '#f0f0f0')))))"
      },
      "txtContent": "=if([$Icon] == 'Docs', '📄', if([$Icon] == 'Forms', '📝', if([$Icon] == 'People', '👥', if([$Icon] == 'Help', '🛟', if([$Icon] == 'Data', '📊', '🔗')))))"
    },
    {
      "elmType": "div",
      "style": {
        "flex-grow": "1",
        "display": "flex",
        "flex-direction": "column",
        "gap": "2px",
        "min-width": "0"
      },
      "children": [
        {
          "elmType": "div",
          "style": {
            "font-size": "16px",
            "font-weight": "700",
            "color": "#201f1e",
            "white-space": "nowrap",
            "overflow": "hidden",
            "text-overflow": "ellipsis"
          },
          "txtContent": "@currentField"
        },
        {
          "elmType": "div",
          "style": {
            "font-size": "13px",
            "font-weight": "500",
            "color": "#5a5a5a",
            "white-space": "nowrap",
            "overflow": "hidden",
            "text-overflow": "ellipsis"
          },
          "txtContent": "[$Description]"
        }
      ]
    },
    {
      "elmType": "div",
      "style": {
        "flex-shrink": "0",
        "font-size": "22px",
        "font-weight": "700",
        "color": "#a19f9d",
        "padding-right": "4px"
      },
      "txtContent": "›"
    }
  ]
}Action Buttons
Turns a quiet SharePoint column into a row of one-click buttons, so people can email, call, or open a link straight from the list instead of copying details out first. Each row shows an Email, Call, and Open button wired to that item’s own fields, and any button whose field is empty simply hides itself so the row never shows a dead link.
Required Columns
| Display name | Column type | Internal name |
|---|---|---|
| Contact | Single line of text | [Title] |
| Single line of text | [Email] | |
| Phone | Single line of text | [Phone] |
| Link | Hyperlink | [Link] |
| Actions | Single line of text | [Actions] |
Prerequisites
- Build a list with these columns before you paste the JSON.
- Then populate the email, phone, and link for each row – leave the Actions column empty, as it only hosts the buttons.
- Internal column names (in brackets) must match the JSON exactly.
JSON Instructions
- Select the Actions column header, then Column settings, then Format this column.
- Switch to Advanced mode.
- Paste the JSON below and click Save.
- Widen the Actions column so the buttons sit on one line.
{
  "$schema": "https://developer.microsoft.com/json-schemas/sp/v2/column-formatting.schema.json",
  "elmType": "div",
  "style": {
    "display": "flex",
    "flex-direction": "row",
    "flex-wrap": "wrap",
    "gap": "8px",
    "align-items": "center",
    "padding": "4px 0"
  },
  "children": [
    {
      "elmType": "a",
      "attributes": {
        "href": "=('mailto:' + [$Email])",
        "target": "_blank",
        "title": "=('Email ' + [$Title])"
      },
      "style": {
        "display": "=if([$Email] == '', 'none', 'inline-flex')",
        "align-items": "center",
        "gap": "6px",
        "padding": "7px 14px",
        "border-radius": "18px",
        "background-color": "#0f6cbd",
        "color": "#ffffff",
        "font-size": "13px",
        "font-weight": "600",
        "line-height": "18px",
        "text-decoration": "none",
        "cursor": "pointer"
      },
      "txtContent": "✉ Email"
    },
    {
      "elmType": "a",
      "attributes": {
        "href": "=('tel:' + [$Phone])",
        "title": "=('Call ' + [$Title])"
      },
      "style": {
        "display": "=if([$Phone] == '', 'none', 'inline-flex')",
        "align-items": "center",
        "gap": "6px",
        "padding": "7px 14px",
        "border-radius": "18px",
        "background-color": "#ffffff",
        "border": "1px solid #0f6cbd",
        "color": "#0f6cbd",
        "font-size": "14px",
        "font-weight": "600",
        "line-height": "18px",
        "text-decoration": "none",
        "cursor": "pointer"
      },
      "txtContent": "📞 Call"
    },
    {
      "elmType": "a",
      "attributes": {
        "href": "[$Link]",
        "target": "_blank",
        "title": "Open link"
      },
      "style": {
        "display": "=if([$Link] == '', 'none', 'inline-flex')",
        "align-items": "center",
        "gap": "6px",
        "padding": "7px 14px",
        "border-radius": "18px",
        "background-color": "#ffffff",
        "border": "1px solid #c8c6c4",
        "color": "#201f1e",
        "font-size": "13px",
        "font-weight": "600",
        "line-height": "18px",
        "text-decoration": "none",
        "cursor": "pointer"
      },
      "txtContent": "↗ Open Link"
    }
  ]
}Weather Card
Shows a status as a little weather scene – a bright sun for healthy, clouds for at risk, a storm for critical – so health reads with a glance and a smile. Each status maps to a weather icon and a matching colored card, with the word kept underneath.
Required Columns
| Display name | Column type | Internal name |
|---|---|---|
| Service | Single line of text | [Title] |
| Outlook | Choice | [Outlook] |
Prerequisites
- Build a list with a choice column for the status before you paste the JSON.
- Then populate the list with status values.
- The JSON keys off specific words (Healthy, At risk, Critical); use these exact words in your choice column or edit the words in the JSON to match yours.
- Apply the formatting to the status column.
- The card uses a compact layout so the icons and labels stay readable without merging adjacent rows.
JSON Instructions
- On the Outlook column, open the column header menu, choose Column settings, then Format this column.
- Switch to Advanced mode.
- Paste the JSON below and click Save.
{
  "$schema": "https://developer.microsoft.com/json-schemas/sp/v2/column-formatting.schema.json",
  "elmType": "div",
  "style": {
    "display": "inline-flex",
    "flex-direction": "column",
    "align-items": "center",
    "width": "56px",
    "padding": "2px 2px",
    "margin": "4px 0",
    "border-radius": "8px",
    "color": "#ffffff",
    "background-color": "=if(@currentField == 'Healthy', '#2f9bd6', if(@currentField == 'At risk', '#7c8794', if(@currentField == 'Critical', '#374151', '#94a3b8')))"
  },
  "children": [
    {
      "elmType": "span",
      "txtContent": "=if(@currentField == 'Healthy', '☀️', if(@currentField == 'At risk', '⛅', if(@currentField == 'Critical', '⛈️', '🌡️')))",
      "style": {
        "font-size": "26px",
        "line-height": "1"
      }
    },
    {
      "elmType": "span",
      "txtContent": "@currentField",
      "style": {
        "font-size": "11px",
        "font-weight": "700",
        "line-height": "1.2",
        "letter-spacing": "0.4px",
        "text-shadow": "0 1px 2px rgba(0,0,0,0.35)",
        "margin-top": "0"
      }
    }
  ]
}Frosted Glass Cell
Wraps a value in a frosted, translucent panel over a vivid colored card, giving a premium, modern look to a headline field. A soft white panel sits over a colored card with a gentle shadow, so a featured item reads like a polished tile.
Required Columns
| Display name | Column type | Internal name |
|---|---|---|
| Release | Single line of text | [Title] |
Prerequisites
- Build a list with a text column before you paste the JSON.
- Then populate the list with values.
- Because the JSON is applied at the column level, the text column can use any name you want.
- The card color and the sub-label live in the JSON – change them to match your brand.
JSON Instructions
- On the Release column, open the column header menu, choose Column settings, then Format this column.
- Switch to Advanced mode.
- Paste the JSON below and click Save.
{
  "$schema": "https://developer.microsoft.com/json-schemas/sp/v2/column-formatting.schema.json",
  "elmType": "div",
  "style": {
    "padding": "4px 0"
  },
  "children": [
    {
      "elmType": "div",
      "style": {
        "display": "inline-block",
        "padding": "8px",
        "border-radius": "11px",
        "background-color": "#5b46d9",
        "box-shadow": "0 4px 12px rgba(91,70,217,0.35)"
      },
      "children": [
        {
          "elmType": "div",
          "style": {
            "padding": "7px 12px",
            "border-radius": "8px",
            "background-color": "rgba(255,255,255,0.22)",
            "border": "1px solid rgba(255,255,255,0.45)"
          },
          "children": [
            {
              "elmType": "div",
              "txtContent": "@currentField",
              "style": {
                "font-size": "13px",
                "font-weight": "700",
                "color": "#ffffff",
                "white-space": "nowrap",
                "text-shadow": "0 1px 2px rgba(0,0,0,0.18)"
              }
            },
            {
              "elmType": "div",
              "txtContent": "Featured",
              "style": {
                "font-size": "10px",
                "font-weight": "600",
                "color": "#ffffff",
                "opacity": "1",
                "text-align": "center",
                "margin-top": "2px",
                "text-shadow": "0 1px 2px rgba(0,0,0,0.15)"
              }
            }
          ]
        }
      ]
    }
  ]
}Employee Shoutout
Turns a plain SharePoint list into a wall of recognition cards, so praise for a teammate reads warmly at a glance instead of sitting in flat rows. Each card carries a category emoji, the person’s name, a colored category tag, the shoutout in quotes, and who gave it, and any card left without a category falls back to a neutral badge so the wall always looks intentional.
Required Columns
| Display name | Column type | Internal name |
|---|---|---|
| Nominee | Single line of text | [Title] |
| Category | Choice | [Category] |
| Message | Multiple lines of text | [Message] |
| From | Single line of text | [From] |
Prerequisites
- Build a list with these columns before you paste the JSON.
- Then populate it – pick a category and write a short shoutout for each person.
- Internal column names (in brackets) must match the JSON exactly.
- The colors key off the category words Teamwork, Innovation, Customer Focus, and Leadership – use these exact words in your choice column or edit them in the JSON to match yours (any other value gets a neutral badge).
JSON Instructions
- Select the Nominee column header, then Column settings, then Format this column.
- Switch to Advanced mode.
- Paste the JSON below and click Save.
- Widen the Nominee column and hide the others so each card has room.
{
  "$schema": "https://developer.microsoft.com/json-schemas/sp/v2/column-formatting.schema.json",
  "elmType": "div",
  "style": {
    "display": "flex",
    "flex-direction": "column",
    "gap": "6px",
    "width": "100%",
    "max-width": "100%",
    "padding": "10px 14px",
    "margin": "4px 0",
    "background-color": "#ffffff",
    "border": "1px solid #e5e7eb",
    "border-left": "=if([$Category] == 'Innovation', '5px solid #8764b8', if([$Category] == 'Customer Focus', '5px solid #038387', if([$Category] == 'Leadership', '5px solid #d65a00', if([$Category] == 'Teamwork', '5px solid #0f6cbd', if([$Category] == 'Above & Beyond', '5px solid #4caf50', '5px solid #9aa0a6')))))",
    "border-radius": "10px",
    "box-shadow": "0 1px 2px rgba(0,0,0,0.08)",
    "box-sizing": "border-box"
  },
  "children": [
    {
      "elmType": "div",
      "style": {
        "display": "flex",
        "flex-direction": "row",
        "align-items": "center",
        "justify-content": "space-between",
        "width": "100%",
        "gap": "14px"
      },
      "children": [
        {
          "elmType": "div",
          "style": {
            "display": "flex",
            "flex-direction": "row",
            "align-items": "center",
            "gap": "10px",
            "min-width": "0",
            "flex-grow": "1"
          },
          "children": [
            {
              "elmType": "div",
              "style": {
                "flex-shrink": "0",
                "width": "34px",
                "height": "34px",
                "border-radius": "50%",
                "display": "flex",
                "align-items": "center",
                "justify-content": "center",
                "font-size": "18px",
                "background-color": "=if([$Category] == 'Innovation', '#efe9f7', if([$Category] == 'Customer Focus', '#e3f2f1', if([$Category] == 'Leadership', '#fbe9df', if([$Category] == 'Teamwork', '#e5f0fa', if([$Category] == 'Above & Beyond', '#e8f5e9', '#f0f0f0')))))"
              },
              "txtContent": "=if([$Category] == 'Innovation', '💡', if([$Category] == 'Customer Focus', '⭐', if([$Category] == 'Leadership', '🧭', if([$Category] == 'Teamwork', '🤝', '🎉'))))"
            },
            {
              "elmType": "div",
              "style": {
                "font-size": "17px",
                "font-weight": "700",
                "color": "#201f1e",
                "white-space": "nowrap",
                "overflow": "hidden",
                "text-overflow": "ellipsis"
              },
              "txtContent": "@currentField"
            }
          ]
        },
        {
          "elmType": "div",
          "style": {
            "flex-shrink": "0",
            "padding": "4px 13px",
            "border-radius": "14px",
            "font-size": "13px",
            "font-weight": "700",
            "color": "#ffffff",
            "text-align": "center",
            "background-color": "=if([$Category] == 'Innovation', '#8764b8', if([$Category] == 'Customer Focus', '#038387', if([$Category] == 'Leadership', '#d65a00', if([$Category] == 'Teamwork', '#0f6cbd', if([$Category] == 'Above & Beyond', '#4caf50', '#9aa0a6')))))"
          },
          "txtContent": "=if([$Category] == '', 'Shoutout', [$Category])"
        }
      ]
    },
    {
      "elmType": "div",
      "style": {
        "font-size": "15px",
        "color": "#2f2f2f",
        "font-style": "italic",
        "line-height": "19px"
      },
      "txtContent": "=if([$Message] == '', 'Recognized by the team', '“' + [$Message] + '”')"
    },
    {
      "elmType": "div",
      "style": {
        "font-size": "13px",
        "line-height": "17px",
        "color": "#4b5563",
        "font-weight": "500"
      },
      "txtContent": "=if([$From] == '', '', '— from ' + [$From])"
    }
  ]
}Stacked Avatars
Renders a multi-person column as a tidy row of overlapping profile photos, so who is assigned reads at a glance like the facepile on a shared document. Each person shows their real Microsoft 365 profile photo, overlapped so a whole team fits in one compact cell.
Required Columns
| Display name | Column type | Internal name |
|---|---|---|
| Task | Single line of text | [Title] |
| Assigned To | Person or Group | [AssignedTo] |
Prerequisites
- Build a list with a person column that allows multiple selections before you paste the JSON.
- Then populate the list, choosing one or more people per row from the people picker.
- Because the JSON is applied at the column level, the person column can use any name you want.
- The photos come from each person’s Microsoft 365 profile – no extra setup is needed.
- Profile-photo display depends on each user’s Microsoft 365 profile and tenant settings, not the JSON – if a photo is missing, SharePoint shows a plain person silhouette in its place, so verify with real licensed users who have profile photos before you rely on it.
JSON Instructions
- On the Assigned To column, open the column header menu, choose Column settings, then Format this column.
- Switch to Advanced mode.
- Paste the JSON below and click Save.
{
  "$schema": "https://developer.microsoft.com/json-schemas/sp/v2/column-formatting.schema.json",
  "elmType": "div",
  "style": {
    "display": "flex",
    "align-items": "center",
    "padding-left": "8px"
  },
  "children": [
    {
      "forEach": "person in @currentField",
      "elmType": "img",
      "attributes": {
        "src": "=getUserImage([$person.email], 'S')",
        "title": "[$person.title]"
      },
      "style": {
        "width": "28px",
        "height": "28px",
        "border-radius": "50%",
        "border": "2px solid #ffffff",
        "margin-left": "-8px"
      }
    }
  ]
}
Org Chart Card
Turns a plain SharePoint list of people into a stack of cards that each show where a person sits in the reporting line, so a team can see who reports to whom at a glance. Because the person and their manager are Person columns, each card shows their real Microsoft 365 profile photos – the person’s large, the manager’s small inside a reports-to chip – and both names are clickable links that email that person, turning a flat list into a lightweight, always-current org view.
Required Columns
| Display name | Column type | Internal name |
|---|---|---|
| Employee | Person or Group | [Employee] |
| Job Title | Single line of text | [JobTitle] |
| Department | Choice | [Department] |
| Reports To | Person or Group | [ReportsTo] |
Prerequisites
- Build a list with these four columns before you paste the JSON.
- Then populate the list, choosing each person and their manager from the people picker.
- Internal column names (in brackets) must match the JSON exactly.
JSON Instructions
- Select the Employee column header, then Column settings, then Format this column.
- Switch to Advanced mode.
- Paste the JSON below and click Save.
- Widen the Employee column and hide the other columns from the view, so each row shows just the card.
{
  "$schema": "https://developer.microsoft.com/json-schemas/sp/v2/column-formatting.schema.json",
  "elmType": "div",
  "style": {
    "display": "flex",
    "flex-direction": "column",
    "align-items": "center",
    "width": "240px",
    "padding": "14px 16px 18px 16px",
    "box-sizing": "border-box",
    "border": "1px solid #edebe9",
    "border-radius": "8px",
    "background-color": "#ffffff"
  },
  "children": [
    {
      "elmType": "div",
      "style": {
        "display": "flex",
        "flex-direction": "row",
        "align-items": "center",
        "max-width": "100%",
        "padding": "3px 10px 3px 3px",
        "border-radius": "12px",
        "background-color": "#f3f2f1",
        "border": "1px solid #e1dfdd",
        "color": "#605e5c",
        "font-size": "11px"
      },
      "children": [
        {
          "elmType": "div",
          "style": {
            "position": "relative",
            "width": "18px",
            "height": "18px",
            "flex-shrink": "0",
            "margin-right": "5px",
            "display": "=if([$ReportsTo.title] == '', 'none', 'block')"
          },
          "children": [
            {
              "elmType": "div",
              "style": {
                "width": "18px",
                "height": "18px",
                "border-radius": "50%",
                "display": "flex",
                "align-items": "center",
                "justify-content": "center",
                "background-color": "#c8c6c4",
                "color": "#ffffff",
                "font-size": "9px",
                "font-weight": "700"
              },
              "txtContent": "=substring([$ReportsTo.title], 0, 1)"
            },
            {
              "elmType": "img",
              "attributes": {
                "src": "[$ReportsTo.picture]",
                "title": "[$ReportsTo.title]"
              },
              "style": {
                "position": "absolute",
                "top": "0px",
                "left": "0px",
                "width": "18px",
                "height": "18px",
                "border-radius": "50%",
                "object-fit": "cover",
                "display": "=if([$ReportsTo.picture] == '', 'none', 'block')"
              }
            }
          ]
        },
        {
          "elmType": "a",
          "attributes": {
            "href": "=if([$ReportsTo.email] == '', '', 'mailto:' + [$ReportsTo.email])",
            "target": "_blank"
          },
          "style": {
            "color": "#605e5c",
            "text-decoration": "none",
            "overflow": "hidden",
            "text-overflow": "ellipsis",
            "white-space": "nowrap",
            "display": "=if([$ReportsTo.title] == '', 'none', 'inline')"
          },
          "txtContent": "='Reports to ' + [$ReportsTo.title]"
        },
        {
          "elmType": "span",
          "style": {
            "display": "=if([$ReportsTo.title] == '', 'inline', 'none')"
          },
          "txtContent": "Top of organization"
        }
      ]
    },
    {
      "elmType": "div",
      "style": { "width": "2px", "height": "14px", "background-color": "#e1dfdd", "margin": "2px 0 6px 0" }
    },
    {
      "elmType": "div",
      "style": {
        "position": "relative",
        "width": "52px",
        "height": "52px",
        "flex-shrink": "0",
        "margin-bottom": "8px"
      },
      "children": [
        {
          "elmType": "div",
          "style": {
            "width": "52px",
            "height": "52px",
            "border-radius": "50%",
            "box-sizing": "border-box",
            "display": "flex",
            "align-items": "center",
            "justify-content": "center",
            "color": "#ffffff",
            "font-size": "17px",
            "font-weight": "700",
            "border": "='3px solid ' + if([$Department] == 'Engineering', '#0078d4', if([$Department] == 'Marketing', '#8764b8', if([$Department] == 'Operations', '#107c10', if([$Department] == 'Finance', '#ca5010', '#c8c6c4'))))",
            "background-color": "=if([$Department] == 'Engineering', '#0078d4', if([$Department] == 'Marketing', '#8764b8', if([$Department] == 'Operations', '#107c10', if([$Department] == 'Finance', '#ca5010', '#8a8886'))))"
          },
          "txtContent": "=substring([$Employee.title], 0, 1) + if(indexOf([$Employee.title], ' ') == -1, '', substring([$Employee.title], indexOf([$Employee.title], ' ') + 1, indexOf([$Employee.title], ' ') + 2))"
        },
        {
          "elmType": "img",
          "attributes": {
            "src": "[$Employee.picture]",
            "title": "[$Employee.title]"
          },
          "style": {
            "position": "absolute",
            "top": "0px",
            "left": "0px",
            "width": "52px",
            "height": "52px",
            "border-radius": "50%",
            "object-fit": "cover",
            "box-sizing": "border-box",
            "border": "='3px solid ' + if([$Department] == 'Engineering', '#0078d4', if([$Department] == 'Marketing', '#8764b8', if([$Department] == 'Operations', '#107c10', if([$Department] == 'Finance', '#ca5010', '#c8c6c4'))))",
            "display": "=if([$Employee.picture] == '', 'none', 'block')"
          }
        }
      ]
    },
    {
      "elmType": "a",
      "attributes": {
        "href": "=if([$Employee.email] == '', '', 'mailto:' + [$Employee.email])",
        "target": "_blank"
      },
      "style": { "font-size": "15px", "font-weight": "600", "color": "#0078d4", "text-decoration": "none", "text-align": "center" },
      "txtContent": "[$Employee.title]"
    },
    {
      "elmType": "div",
      "style": { "font-size": "13px", "color": "#605e5c", "text-align": "center", "margin-top": "2px" },
      "txtContent": "[$JobTitle]"
    },
    {
      "elmType": "div",
      "style": {
        "font-size": "11px",
        "font-weight": "600",
        "margin-top": "8px",
        "padding": "2px 10px",
        "border-radius": "12px",
        "color": "=if([$Department] == 'Engineering', '#0c447c', if([$Department] == 'Marketing', '#3b2e58', if([$Department] == 'Operations', '#0b3b09', if([$Department] == 'Finance', '#7a3309', '#3b3a39'))))",
        "background-color": "=if([$Department] == 'Engineering', '#e6f1fb', if([$Department] == 'Marketing', '#f0ebf8', if([$Department] == 'Operations', '#eaf3de', if([$Department] == 'Finance', '#fbeee0', '#f3f2f1'))))"
      },
      "txtContent": "[$Department]"
    }
  ]
}File Type Icon
Shows a colored badge with the file extension next to each file name, so a document library reads at a glance by type instead of as a wall of similar rows. Each file gets a colored tag – red for PDF, blue for Word, green for Excel, and so on – keyed to its extension, and folders are marked too.
Prerequisites
- Open your document library (or create one and upload a few files).
- Internal column names (in brackets) must match the JSON exactly.
- Use a SharePoint document library, not a standard Microsoft List – the badge reads the file metadata that a library supplies.
- SharePoint may still show its own small built-in file icon next to the name; that icon comes from the library interface and is separate from this formatter.
JSON Instructions
- On the Name column, open the column header menu, choose Column settings, then Format this column.
- Switch to Advanced mode.
- Paste the JSON below and click Save.
{
  "$schema": "https://developer.microsoft.com/json-schemas/sp/v2/column-formatting.schema.json",
  "elmType": "div",
  "style": {
    "display": "flex",
    "align-items": "center",
    "height": "100%",
    "width": "100%",
    "min-height": "32px"
  },
  "children": [
    {
      "elmType": "div",
      "style": {
        "display": "flex",
        "align-items": "center",
        "justify-content": "center",
        "width": "38px",
        "height": "26px",
        "border-radius": "4px",
        "flex-shrink": "0",
        "margin-right": "10px",
        "background-color": "=if([$File_x0020_Type] == 'pdf', '#d13438', if([$File_x0020_Type] == 'doc', '#2b579a', if([$File_x0020_Type] == 'docx', '#2b579a', if([$File_x0020_Type] == 'xls', '#217346', if([$File_x0020_Type] == 'xlsx', '#217346', if([$File_x0020_Type] == 'ppt', '#c43e1c', if([$File_x0020_Type] == 'pptx', '#c43e1c', if([$File_x0020_Type] == 'png', '#8764b8', if([$File_x0020_Type] == 'jpg', '#8764b8', if([$File_x0020_Type] == 'jpeg', '#8764b8', if([$File_x0020_Type] == 'gif', '#8764b8', if([$File_x0020_Type] == 'txt', '#595959', if([$File_x0020_Type] == 'zip', '#8a8886', if([$File_x0020_Type] == 'csv', '#217346', '#605e5c'))))))))))))))"
      },
      "children": [
        {
          "elmType": "span",
          "style": {
            "font-size": "10px",
            "font-weight": "700",
            "color": "#fff36b",
            "letter-spacing": "0.3px"
          },
          "txtContent": "=if([$File_x0020_Type] == '', 'DIR', toUpperCase([$File_x0020_Type]))"
        }
      ]
    },
    {
      "elmType": "span",
      "style": {
        "font-size": "14px",
        "font-weight": "500",
        "line-height": "20px",
        "color": "#1f1f1f",
        "letter-spacing": "0.1px"
      },
      "txtContent": "[$FileLeafRef]"
    }
  ]
}New Item Highlight
Marks files added or changed in the last week with a NEW ribbon, so fresh content is easy to spot in a busy library. The badge appears automatically based on the created date and disappears once a file is no longer recent.
Required Columns
| Display name | Column type |
|---|---|
| Name | System Column |
| Created | System Column |
Prerequisites
- Open your document library (or create one and upload a few files).
JSON Instructions
- On the Name column, open the column header menu, choose Column settings, then Format this column.
- Switch to Advanced mode.
- Paste the JSON below and click Save.
{
  "$schema": "https://developer.microsoft.com/json-schemas/sp/v2/column-formatting.schema.json",
  "elmType": "div",
  "style": {
    "display": "flex",
    "align-items": "center"
  },
  "children": [
    {
      "elmType": "span",
      "style": {
        "font-size": "13px",
        "color": "#242424"
      },
      "txtContent": "[$FileLeafRef]"
    },
    {
      "elmType": "div",
      "style": {
        "display": "=if(Number(Date([$Created])) >= Number(Date(addDays(@now, -7))), 'inline-flex', 'none')",
        "align-items": "center",
        "margin-left": "10px",
        "padding": "1px 8px",
        "border-radius": "10px",
        "background-color": "#107c10"
      },
      "children": [
        {
          "elmType": "span",
          "style": {
            "font-size": "10px",
            "font-weight": "700",
            "color": "#ffffff",
            "letter-spacing": "0.5px"
          },
          "txtContent": "NEW"
        }
      ]
    }
  ]
}File Preview Thumbnail
Shows a small inline preview of each file next to its name, so you can recognize a document at a glance without opening it. Each row shows a compact thumbnail beside the file name, and files without a preview fall back to a file-type icon.
Required Columns
| Display name | Column type |
|---|---|
| Name | System Column |
| File type | System Column |
Prerequisites
- Open your document library (or create one and upload a few files).
JSON Instructions
- On the Name column, open the column header menu, choose Column settings, then Format this column.
- Switch to Advanced mode.
- Paste the JSON below and click Save.
{
  "$schema": "https://developer.microsoft.com/json-schemas/sp/v2/column-formatting.schema.json",
  "elmType": "div",
  "style": {
    "display": "flex",
    "align-items": "center"
  },
  "children": [
    {
      "elmType": "div",
      "style": {
        "position": "relative",
        "width": "36px",
        "height": "36px",
        "flex-shrink": "0",
        "margin-right": "10px"
      },
      "children": [
        {
          "elmType": "filepreview",
          "attributes": {
            "src": "@thumbnail.medium"
          },
          "style": {
            "width": "36px",
            "height": "36px",
            "border-radius": "4px",
            "border": "1px solid #edebe9",
            "box-sizing": "border-box",
            "display": "=if([$File_x0020_Type] == 'pdf' || [$File_x0020_Type] == 'doc' || [$File_x0020_Type] == 'docx' || [$File_x0020_Type] == 'xls' || [$File_x0020_Type] == 'xlsx' || [$File_x0020_Type] == 'ppt' || [$File_x0020_Type] == 'pptx' || [$File_x0020_Type] == 'png' || [$File_x0020_Type] == 'jpg' || [$File_x0020_Type] == 'jpeg' || [$File_x0020_Type] == 'gif' || [$File_x0020_Type] == 'bmp' || [$File_x0020_Type] == 'tif' || [$File_x0020_Type] == 'tiff', 'block', 'none')"
          }
        },
        {
          "elmType": "div",
          "style": {
            "width": "36px",
            "height": "36px",
            "border-radius": "4px",
            "box-sizing": "border-box",
            "background-color": "#ffffff",
            "border": "1px solid #edebe9",
            "display": "=if([$File_x0020_Type] == 'pdf' || [$File_x0020_Type] == 'doc' || [$File_x0020_Type] == 'docx' || [$File_x0020_Type] == 'xls' || [$File_x0020_Type] == 'xlsx' || [$File_x0020_Type] == 'ppt' || [$File_x0020_Type] == 'pptx' || [$File_x0020_Type] == 'png' || [$File_x0020_Type] == 'jpg' || [$File_x0020_Type] == 'jpeg' || [$File_x0020_Type] == 'gif' || [$File_x0020_Type] == 'bmp' || [$File_x0020_Type] == 'tif' || [$File_x0020_Type] == 'tiff', 'none', 'flex')",
            "align-items": "center",
            "justify-content": "center"
          },
          "children": [
            {
              "elmType": "span",
              "style": {
                "font-size": "9.5px",
                "font-weight": "700",
                "letter-spacing": "0.3px",
                "line-height": "16px",
                "padding": "0 7px",
                "border-radius": "4px",
                "background-color": "=if([$File_x0020_Type] == '', '#fff3cf', if([$File_x0020_Type] == 'zip', '#fff4ce', if([$File_x0020_Type] == 'txt', '#eaf2fb', if([$File_x0020_Type] == 'csv', '#e7f3e8', '#f3f2f1'))))",
                "border": "=if([$File_x0020_Type] == '', '1px solid #e4b647', if([$File_x0020_Type] == 'zip', '1px solid #f0dfa0', if([$File_x0020_Type] == 'txt', '1px solid #b9d7f0', if([$File_x0020_Type] == 'csv', '1px solid #b7dfba', '1px solid #d2d0ce'))))",
                "color": "=if([$File_x0020_Type] == '', '#7a5c00', if([$File_x0020_Type] == 'zip', '#8a6d00', if([$File_x0020_Type] == 'txt', '#0b5cab', if([$File_x0020_Type] == 'csv', '#0b6a0b', '#605e5c'))))"
              },
              "txtContent": "=if([$File_x0020_Type] == '', 'DIR', toUpperCase([$File_x0020_Type]))"
            }
          ]
        }
      ]
    },
    {
      "elmType": "span",
      "style": {
        "font-size": "13px",
        "color": "#242424"
      },
      "txtContent": "[$FileLeafRef]"
    }
  ]
}Sensitivity Label
Shows a document’s confidentiality level – Public, Internal, Confidential, or Restricted – as a clear colored tag with a lock icon, so handling expectations are obvious at a glance. Each level gets its own color so the most sensitive files stand out.
Required Columns
| Display name | Column type | Internal name |
|---|---|---|
| Sensitivity | Choice | [Sensitivity] |
Prerequisites
- Open your document library and add a Choice column named Sensitivity (Public, Internal, Confidential, Restricted).
- Because the JSON is applied at the column level, the Sensitivity column can use any name you want.
JSON Instructions
- On the Sensitivity column, open the column header menu, choose Column settings, then Format this column.
- Switch to Advanced mode.
- Paste the JSON below and click Save.
{
  "$schema": "https://developer.microsoft.com/json-schemas/sp/v2/column-formatting.schema.json",
  "elmType": "div",
  "style": {
    "display": "inline-flex",
    "align-items": "center",
    "justify-content": "center",
    "box-sizing": "border-box",
    "min-width": "=if(@currentField == '', '86px', '120px')",
    "height": "26px",
    "padding": "2px 10px",
    "border-radius": "4px",
    "background-color": "=if(@currentField == 'Public', '#e7f3e8', if(@currentField == 'Internal', '#eaf2fb', if(@currentField == 'Confidential', '#fde7e9', if(@currentField == 'Restricted', '#f7e5f6', '#f3f2f1'))))",
    "border": "=if(@currentField == 'Public', '1px solid #b7dfba', if(@currentField == 'Internal', '1px solid #b9d7f0', if(@currentField == 'Confidential', '1px solid #f1aeb5', if(@currentField == 'Restricted', '1px solid #e3b7e8', '1px solid #d2d0ce'))))"
  },
  "children": [
    {
      "elmType": "span",
      "attributes": {
        "iconName": "=if(@currentField == '', 'TagUnknown', 'Lock')"
      },
      "style": {
        "font-size": "12px",
        "margin-right": "6px",
        "color": "=if(@currentField == 'Public', '#0b6a0b', if(@currentField == 'Internal', '#0b5cab', if(@currentField == 'Confidential', '#c50f1f', if(@currentField == 'Restricted', '#7a1f8a', '#605e5c'))))"
      }
    },
    {
      "elmType": "span",
      "style": {
        "font-size": "12px",
        "font-weight": "600",
        "white-space": "nowrap",
        "overflow": "hidden",
        "text-overflow": "ellipsis",
        "color": "=if(@currentField == 'Public', '#0b6a0b', if(@currentField == 'Internal', '#0b5cab', if(@currentField == 'Confidential', '#c50f1f', if(@currentField == 'Restricted', '#7a1f8a', '#605e5c'))))"
      },
      "txtContent": "=if(@currentField == '', 'No label', @currentField)"
    }
  ]
}Folder Highlight
Visually distinguishes folders from files in a SharePoint library, so the structure of a mixed library is obvious at a glance. Folders get a colored folder icon, a soft tint, and a bolder name, while files keep a simple file icon, making it easy to see where to click in.
Required Columns
| Display name | Column type |
|---|---|
| Name | System Column |
| File type | System Column |
Prerequisites
- Open your document library (or create one and upload a few files).
JSON Instructions
- On the Name column, open the column header menu, choose Column settings, then Format this column.
- Switch to Advanced mode.
- Paste the JSON below and click Save.
{
  "$schema": "https://developer.microsoft.com/json-schemas/sp/v2/column-formatting.schema.json",
  "elmType": "div",
  "style": {
    "display": "flex",
    "align-items": "center",
    "box-sizing": "border-box",
    "width": "100%",
    "max-width": "100%",
    "min-height": "38px",
    "padding": "=if([$File_x0020_Type] == '', '4px 10px 4px 8px', '0')",
    "border-left": "=if([$File_x0020_Type] == '', '3px solid #e4b647', '0')",
    "border-radius": "=if([$File_x0020_Type] == '', '4px', '0')",
    "background-color": "=if([$File_x0020_Type] == '', '#fff3cf', 'transparent')"
  },
  "children": [
    {
      "elmType": "span",
      "style": {
        "font-size": "13.5px",
        "line-height": "18px",
        "color": "#242424",
        "font-weight": "=if([$File_x0020_Type] == '', '600', '400')",
        "white-space": "nowrap",
        "overflow": "hidden",
        "text-overflow": "ellipsis"
      },
      "txtContent": "[$FileLeafRef]"
    }
  ]
}Review-Due Flag
Highlights documents that are past their review or expiry date, so nothing slips through unreviewed in a controlled library. Files past due show a red flag, files due soon show an amber one, and everything else shows a tidy date.
Required Columns
| Display name | Column type | Internal name |
|---|---|---|
| Review Date | Date and time | [ReviewDate] |
Prerequisites
- Open your document library and add a Date column named Review Date.
- Because the JSON is applied at the column level, the Review Date column can use any name you want.
JSON Instructions
- On the Review Date column, open the column header menu, choose Column settings, then Format this column.
- Switch to Advanced mode.
- Paste the JSON below and click Save.
{
  "$schema": "https://developer.microsoft.com/json-schemas/sp/v2/column-formatting.schema.json",
  "elmType": "span",
  "style": {
    "display": "inline-flex",
    "align-items": "center",
    "width": "170px",
    "box-sizing": "border-box",
    "padding": "1px 7px",
    "border-radius": "6px",
    "line-height": "20px",
    "white-space": "nowrap",
    "background-color": "=if(@currentField == '', 'transparent', if(Number(Date(@currentField)) < Number(Date(@now)), '#fdeceb', if(Number(Date(@currentField)) < Number(addDays(Date(@now), 14)), '#fdf3d6', '#f3f2f1')))"
  },
  "children": [
    {
      "elmType": "span",
      "attributes": {
        "iconName": "=if(@currentField == '', 'Calendar', if(Number(Date(@currentField)) < Number(Date(@now)), 'Warning', 'Calendar'))"
      },
      "style": {
        "font-size": "11px",
        "margin-right": "5px",
        "line-height": "20px",
        "color": "=if(@currentField == '', '#8a8886', if(Number(Date(@currentField)) < Number(Date(@now)), '#a4262c', if(Number(Date(@currentField)) < Number(addDays(Date(@now), 14)), '#7a5c00', '#605e5c')))"
      }
    },
    {
      "elmType": "span",
      "style": {
        "font-size": "12px",
        "font-weight": "600",
        "line-height": "20px",
        "white-space": "nowrap",
        "overflow": "hidden",
        "text-overflow": "ellipsis",
        "color": "=if(@currentField == '', '#8a8886', if(Number(Date(@currentField)) < Number(Date(@now)), '#a4262c', if(Number(Date(@currentField)) < Number(addDays(Date(@now), 14)), '#7a5c00', '#605e5c')))"
      },
      "txtContent": "=if(@currentField == '', 'No date', if(Number(Date(@currentField)) < Number(Date(@now)), 'Review due - ' + toLocaleDateString(@currentField), 'Review ' + toLocaleDateString(@currentField)))"
    }
  ]
}Approval Status Badge
Shows a document’s status – Draft, In Review, Approved, or Rejected – as a clean colored pill, so the state of every file in a library is clear at a glance. Each value gets its own color so approved files read green, in-review amber, and so on.
Required Columns
| Display name | Column type | Internal name |
|---|---|---|
| Approval Status | Choice | [ApprovalStatus] |
Prerequisites
- Open your document library and add a Choice column named Approval Status (Draft, In Review, Approved, Rejected).
- Because the JSON is applied at the column level, the Approval Status column can use any name you want.
JSON Instructions
- On the Approval Status column, open the column header menu, choose Column settings, then Format this column.
- Switch to Advanced mode.
- Paste the JSON below and click Save.
{
  "$schema": "https://developer.microsoft.com/json-schemas/sp/v2/column-formatting.schema.json",
  "elmType": "div",
  "style": {
    "display": "flex",
    "align-items": "center",
    "justify-content": "center",
    "box-sizing": "border-box",
    "height": "28px",
    "width": "100%",
    "max-width": "118px",
    "padding": "2px 8px",
    "margin": "3px 0",
    "border-radius": "8px",
    "background-color": "=if(@currentField == 'Draft', '#eeeeee', if(@currentField == 'In Review', '#ffe8a3', if(@currentField == 'Approved', '#d6f0dc', if(@currentField == 'Rejected', '#ffd6d9', '#eeeeee'))))"
  },
  "children": [
    {
      "elmType": "span",
      "style": {
        "font-size": "12px",
        "font-weight": "600",
        "line-height": "16px",
        "white-space": "nowrap",
        "color": "=if(@currentField == 'Draft', '#323130', if(@currentField == 'In Review', '#6f4e00', if(@currentField == 'Approved', '#007000', if(@currentField == 'Rejected', '#a80000', '#323130'))))"
      },
      "txtContent": "@currentField"
    }
  ]
}Edit Properties Button
Gives people the ability to edit an item’s properties with one click, straight from the library view, instead of digging through the three-dot menu or the Details pane. Because the button sits on every row, missing metadata is easy to spot and easy to fix, which keeps the columns your views, filters, and search depend on actually filled in.
Required Columns
| Display name | Column type | Internal name |
|---|---|---|
| Properties | Single line of text | [Properties] |
Prerequisites
- Add a Single line of text column named Properties to the library – it only hosts the button.
- Leave the column empty. The button is drawn entirely by the JSON, so there is nothing to populate.
- The same button appears on every row, so files and folders are both covered with no extra setup.
JSON Instructions
- Select the Properties column header, then Column settings, then Format this column.
- Switch to Advanced mode.
- Paste the JSON below and click Save.
- Widen the Properties column so the label sits on one line.
{
  "$schema": "https://developer.microsoft.com/json-schemas/sp/v2/column-formatting.schema.json",
  "elmType": "button",
  "customRowAction": { "action": "editProps" },
  "style": {
    "border": "none",
    "background-color": "transparent",
    "cursor": "pointer",
    "padding": "0",
    "color": "#A4262C",
    "font-weight": "600"
  },
  "children": [
    { "elmType": "span", "attributes": { "iconName": "Info" }, "style": { "padding-right": "6px" } },
    { "elmType": "span", "txtContent": "Edit Properties" }
  ]
}Common Questions About Column Formatting
What is column formatting in SharePoint?
Column formatting controls how the values in a single column appear, using JSON or a no-code design panel. It can apply colors, data bars, icons, links, and action buttons based on each item value, without changing the stored data. It is the quickest way to make a list readable at a glance, turning plain text like a status field into colored pills or icons.
Do I need to know JSON to use it?
Not for the common cases. The Format this column panel includes a design mode with ready-made choices for colors and icons that require no code. For anything beyond that – custom thresholds, buttons, or referencing other columns – you switch to advanced mode and paste a JSON snippet. Many teams start in design mode and only reach for JSON when they need something specific.
What is the difference between column and view formatting?
Column formatting styles one field, while view formatting restyles the entire row. If you want a single status column to show colored labels, that is column formatting. If you want the whole row to turn red when an item is overdue, that is view formatting. They use the same JSON approach and can be combined on the same list.
Does column formatting change the underlying data?
No. Formatting is purely visual and lives on the view, not on the items. The values stored in the list stay exactly as entered, so exports, flows, and searches see the raw data. This makes formatting safe to experiment with, since clearing it returns the column to its default appearance with nothing lost.
Which column types can be formatted?
Most common types support formatting, including text, choice, number, date, person, and yes or no columns. Some specialized types offer fewer options, and a few cannot be formatted at all. The design panel only shows the choices that the selected column supports, which is a quick way to see what is possible before reaching for JSON.
Is column formatting worth the effort?
For lists that people read often, yes. Greg Zelfond, the consultant behind LookBook 365, uses formatting to make trackers self-explanatory: a glance at the colors tells the team what is on track and what needs attention, with no training required. The effort is small and it pays back every time someone opens the list, which is the mark of a design that earns its keep.